Initial Data Analysis
Initial Data Analysis. Frequency. IDA. Often overlooked or sloughed off as being not all that important but…

Initial Data Analysis
E N D
Presentation Transcript
Initial Data Analysis Frequency
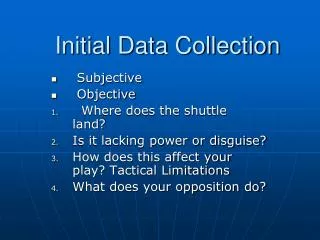
IDA • Often overlooked or sloughed off as being not all that important but… • It is at the beginning stages where much trouble can be avoided and if the data is glossed over this can lead to missed findings or results that will not be able to be replicated because they represent bad data. • Bad data?
IDA includes: • A healthy inspection of the individual variables’ behaviors • Outlier analysis • Descriptive and graphical output
Describing and Exploring Data • Once a bunch of data has been collected, the raw numbers must be manipulated in some fashion to make them more informative. • Several options are available includingplotting the data or calculating descriptive statistics.
Plotting Data • Often, the first thing one does with a set of raw data is to plot frequency distributions. • Usually this is done by first creating a table of the frequencies broken down by values of the relevant variable, then the frequencies in the table are plotted in a histogram.
Frequency Data • Example: Age as estimated by a questionnaire in a statistics class. • Note: The frequencies in the adjacent table were calculated by simply counting the number of subjects having the specified value for the age variable.
Grouping data • Plotting is easy when the variable of interest has a relatively small number of values (like our age variable did). • However, the values of a variable are sometimes more continuous, resulting in uninformative frequency plots if done in the above manner.
Grouped Frequency DistributionExample: Binning our weight variable. • For example, with a variable like weight we might obtain a range from 100 lb. to 200 lb. If we used the previously described technique, we would end up with 100 bars, most of which with a frequency less than 2 or 3 (and many with a frequency of zero). • We can get around this problem by grouping our values into bins. Try for around 10 classes (or bins) with natural splits.
Graphic Depiction of Frequency • Histogram • Similar to a bar chart with the only difference being that histograms are representative of non-nominal data. • Age example
Weight example • Check out this demowhich clearly shows how the width of the bin that you select can clearly affect the “look” of the data • Here is another similar demonstration of the effects of bin width
Number of Classes and Class Width • The number of classes should be between 5 and 15. • Fewer than 5 classes cause excessive summarization. • More than 15 classes tends not to add much. • Class Width • Divide the range by the number of classes for an approximate class width • Round up to a convenient number
42 26 32 34 57 30 58 37 50 30 53 40 30 47 49 50 40 32 31 40 52 28 23 35 25 30 36 32 26 50 55 30 58 64 52 49 33 43 46 32 61 31 30 40 60 74 37 29 43 54 Example of Ungrouped Data Scores on a social introversion inventory
Relative Frequency Relative Class Interval Frequency Frequency 20-under 30 6 .12 30-under 40 18 .36 40-under 50 11 .22 50-under 60 11 .22 60-under 70 3 .06 70-under 80 1 .02 Total 50 1.00
Cumulative Frequency Cumulative Class Interval Frequency Frequency 20-under 30 6 6 30-under 40 18 24 40-under 50 11 35 50-under 60 11 46 60-under 70 3 49 70-under 80 1 50 Total 50
Class Midpoints, Relative Frequencies, and Cumulative Frequencies Relative Cumulative Class Interval Frequency Midpoint Frequency Frequency 20-under 30 6 25 .12 6 30-under 40 18 35 .36 24 40-under 50 11 45 .22 35 50-under 60 11 55 .22 46 60-under 70 3 65 .06 49 70-under 80 1 75 .02 50 Total 50 1.00
Cumulative Relative Frequencies Cumulative Relative Cumulative Relative Class Interval Frequency Frequency Frequency Frequency 20-under 30 6 .12 6 .12 30-under 40 18 .36 24 .48 40-under 50 11 .22 35 .70 50-under 60 11 .22 46 .92 60-under 70 3 .06 49 .98 70-under 80 1 .02 50 1.00 Total 50 1.00
Histogram Construction Class Interval Frequency 20-under 30 6 30-under 40 18 40-under 50 11 50-under 60 11 60-under 70 3 70-under 80 1
Frequency Polygon Class Interval Frequency 20-under 30 6 30-under 40 18 40-under 50 11 50-under 60 11 60-under 70 3 70-under 80 1
Advantages/Disadvantages • With the grouped frequency distribution we can take large data sets and make them much more manageable and easier to understand. • However, we also lose information about individual data points.
Stem and Leaf Plots • If values of a variable must be grouped prior to creating a frequency plot, then the information related to the specific values becomes lost in the process (i.e., the resulting graph depicts only the frequency values associated with the grouped values). • However, it is possible to obtain the graphical advantage of grouping and still keep all of the information if stem & leaf plots are used.
Stem and Leaf Plots • These plots are created by splitting a data point into that part associated with the ‘group’ and that associated with the individual point. • For example, the numbers 180, 180, 181, 182, 185, 186, 187, 187, 189 could be represented as: • 18 001256779
86 77 91 60 55 76 92 47 88 67 23 59 72 75 83 77 68 82 97 89 81 75 74 39 67 79 83 70 78 91 68 49 56 94 81 Stem Leaf Raw Data 2 3 4 5 6 7 8 9 3 9 7 9 5 6 9 0 7 7 8 8 0 2 4 5 5 6 7 7 8 9 1 1 2 3 3 6 8 9 1 1 2 4 7
86 77 91 60 55 76 92 47 88 67 23 59 72 75 83 77 68 82 97 89 81 75 74 39 67 79 83 70 78 91 68 49 56 94 81 Construction of Stem and Leaf Plot Stem Leaf Raw Data 2 3 4 5 6 7 8 9 3 9 7 9 5 6 9 0 7 7 8 8 0 2 4 5 5 6 7 7 8 9 1 1 2 3 3 6 8 9 1 1 2 4 7 Stem Leaf Stem Leaf
Thus, we could represent our weight data in the following stem & leaf plot:
Stem & leaf plots are especially nice for comparing distributions.
Advantages • Using a stem and leaf offers several advantages • It retains individual data points • Displays large amounts of data well (compared to a normal frequency distribution) • Provides a ‘graphical’ display of the data • Disadvantage • Kind of ugly
Terminology Related to Distributions • Often, frequency histograms tend to have a roughly symmetrical bell-shape and such distributions are called normal or gaussian.
Sometimes, the bell shape is not symmetrical. • The term positive skew refers to the situation where the “tail” of the distribution is to the right, negative skew is when the “tail” is to the left.