Jan Clevers 1 & Anatoly Gitelson 2
Jan Clevers. Using the red-edge bands on Sentinel-2 for retrieving canopy chlorophyll and nitrogen content. Jan Clevers 1 & Anatoly Gitelson 2. Introduction

Jan Clevers 1 & Anatoly Gitelson 2
E N D
Presentation Transcript
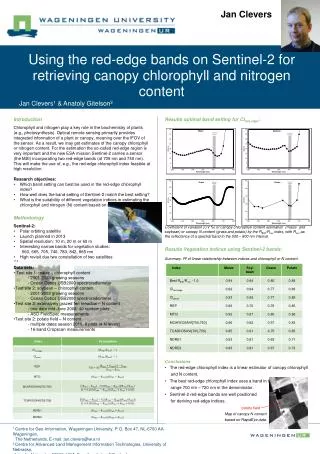
Jan Clevers Using the red-edge bands on Sentinel-2 for retrieving canopy chlorophyll and nitrogen content Jan Clevers1 & Anatoly Gitelson2 • Introduction • Chlorophyll and nitrogen play a key role in the biochemistry of plants (e.g., photosynthesis). Optical remote sensing primarily provides integrated information of a plant or canopy, meaning over the IFOV of the sensor. As a result, we may get estimates of the canopy chlorophyll or nitrogen content. For the estimation the so-called red-edge region is very important and the new ESA mission Sentinel-2 carries a sensor (the MSI) incorporating two red-edge bands (at 705 nm and 740 nm). This will make the use of, e.g., the red-edge chlorophyll index feasible at high resolution. • Research objectives: • Which band setting can best be used in the red-edge chlorophyll index? • How well does the band setting of Sentinel-2 match the best setting? • What is the suitability of different vegetation indices in estimating the chlorophyll and nitrogen (N) content based on Sentinel-2? • Methodology • Sentinel-2: • Polar orbiting satellite • Launch planned in 2013 • Spatial resolution: 10 m, 20 m or 60 m • Interesting narrow bands for vegetation studies: • 560, 665, 705, 740, 783, 842, 865 nm • High revisit due two constellation of two satellites • 11.3 • Data sets: • Test site 1: maize – chlorophyll content • - 2001-2003 growing seasons • - Ocean Optics USB2000 spectroradiometer • Test site 2: soybean – chlorophyll content • - 2001-2003 growing seasons • - Ocean Optics USB2000 spectroradiometer • Test site 3: extensively grazed fen meadow – N content • - one date mid-June 2008, 40 random plots • - ASD FieldSpec measurements • Test site 2: potato field – N content • - multiple dates season 2010, 8 plots (4 N levels) • - 16-band Cropscanmeasurements • Indices tested for chlorophyll and nitrogen estimation: • Results optimal band setting for CIred-edge: • Coefficient of variation (CV %) of canopy chlorophyll content estimation (maize and soybean) or canopy N content (grass and potato) by the R800/Rxxx index, with Rxxx as the reflectance of a spectral band in the 500 – 800 nm interval. • Results Vegetation indices using Sentinel-2 bands: • Summary: R2 of linear relationship between indices and chlorophyll or N content. • Conclusions • The red-edge chlorophyll index is a linear estimator of canopy chlorophyll • and N content. • The best red-edge chlorophyll index uses a band in the • range 700 nm – 720 nm in the denominator. • Sentinel-2 red-edge bands are well positioned • for deriving red-edge indices. • potato field • Map of canopy N content • based on RapidEye data. 1 Centre for Geo-Information, Wageningen University, P.O. Box 47, NL-6700 AA Wageningen, The Netherlands, E-mail: jan.clevers@wur.nl 2 Centre for Advanced Land Management Information Technologies, University of Nebraska, Lincoln, Nebraska, 58588, USA, E-mail: agitelson2@unl.edu