
Graphing Charles' Law: Temperature-Volume Data for Hydrogen Gas
This exercise involves graphing the Temperature-Volume data for two molar quantities of hydrogen gas (H2) according to Charles' Law. You will plot the data on the provided grid and extend the trend lines until they intersect with the temperature axis (x-axis). This demonstrates the relationship between temperature and volume for gaseous substances, highlighting the direct proportionality described by Charles' Law. Utilize the information provided by Jason Fisher and Danny Hickie in the appendix to complete this task effectively.

Graphing Charles' Law: Temperature-Volume Data for Hydrogen Gas
E N D
Presentation Transcript
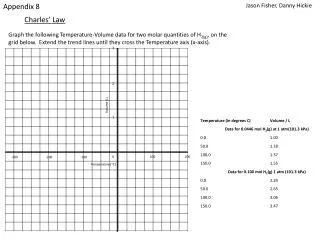
Appendix 8 Jason Fisher, Danny Hickie Charles’ Law Graph the following Temperature-Volume data for two molar quantities of H2(g), on the grid below. Extend the trend lines until they cross the Temperature axis (x-axis). 3 2 Volume (L) 1 0 100 200 -200 -100 -300 Temperature( oC)
Appendix 8 ctd Jason Fisher, Danny Hickie Charles’ Law – Sample Completed Copy Graph the following Temperature-Volume data for two molar quantities of H2(g), on the grid below. Extend the trend lines until they cross the Temperature axis (x-axis).


