Overall method
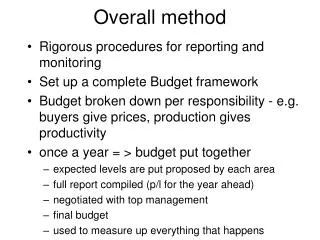
Overall method. Rigorous procedures for reporting and monitoring Set up a complete Budget framework Budget broken down per responsibility - e.g. buyers give prices, production gives productivity once a year = > budget put together expected levels are put proposed by each area

Overall method
E N D
Presentation Transcript
Overall method • Rigorous procedures for reporting and monitoring • Set up a complete Budget framework • Budget broken down per responsibility - e.g. buyers give prices, production gives productivity • once a year = > budget put together • expected levels are put proposed by each area • full report compiled (p/l for the year ahead) • negotiated with top management • final budget • used to measure up everything that happens
General Indicators - monitoring the business • Focus on 3 key indicators compared with budget makes it easier to analyse responsibilities: • volume V (Vb for budget and Va for actuals) • price P • formula F • total variance = Va Pa Fa - Vb Pb Fb • volume variance = Va Pb Fb - Vb Pb Fb = (Va-Vb) Pb Fb • Price variance = Va Pa Fa - Va Pb Fa = (Pa - Pb) Va Fa • Formula variance = Va Pb Fa - Va Pb Fb = (Fa - Fb) Va Pb Applies to the cost side E.g. Pb Fb note that total = tot var
Analysing the general indicators • Volume variance : • breakdown per product / market / week • also per rep? • source: budget / weekly sales • who? Sales Director and reps + regional supervisors + MD • colour maps showing areas / markets • threshold values determine colour • volume and £ figure
Analysing the general indicators • Price variance: • breakdown per RM / component + labour (for each category) [focus on most expensive] • buyers / production director + supervisors +personnel director • source: budget figures + account payable / payroll • Monthly probably enough (changes don’t occur that often) • tables for detail + exception reporting using shape of RM that is causing the variance to be negative
Analysing the general indicators • Formula variance: • per product / per RM + labout • source: stock out sheets + production sheets (sales too late) + personnel hours • some figures cannot be known exactly => use surrogate or estimate • target: foremen, production staff and director • gauges, colour map of the factory, colour coded £ signs