Non-parametric statistical methods for testing questionable data-population assumptions
Non-parametric statistical methods for testing questionable data-population assumptions. Philip Twumasi-Ankrah, PhD November 15, 2012. Parametric or Non-Parametric Tests. Choosing the right test to compare measurements is a bit tricky, as you must choose between two families of tests:

Non-parametric statistical methods for testing questionable data-population assumptions
E N D
Presentation Transcript
Non-parametric statistical methods for testing questionable data-population assumptions Philip Twumasi-Ankrah, PhD November 15, 2012
Parametric or Non-Parametric Tests • Choosing the right test to compare measurements is a bit tricky, as you must choose between two families of tests: • parametric and • nonparametric
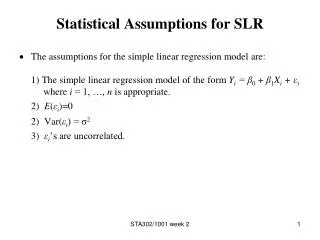
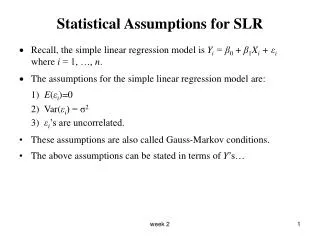
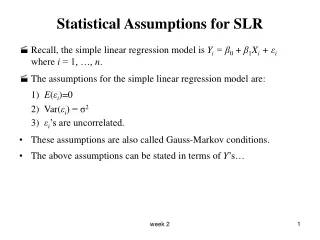
Parametric Tests • Parametric statistical test are based upon the assumption that the data are sampled from a Gaussian distribution. • These tests include the t test and analysis of variance.
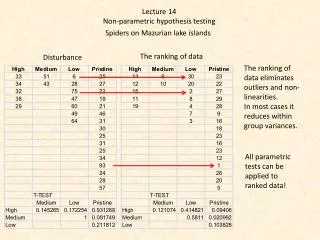
Non-Parametric Tests • Tests that do not make assumptions about the population distribution are referred to as nonparametric- tests. • All commonly used nonparametric tests rank the outcome variable from low to high and then analyze the ranks. • These tests include the Wilcoxon, Mann-Whitney test, and Kruskal-Wallis tests. • These tests are also called distribution-free tests.
Validity of Assumptions • For Parametric statistical tests, it is important that the assumptions made on the probability distribution is valid. • If this assumption about the data is true, parametric tests are: • more powerful than their equivalent non-parametric counterparts • can detect differences with smaller sample sizes, • detect smaller differences with the same sample size.
Tests of Normality • It is usually important to assure yourself of the validity of the Normality Assumption. • This involves tests of univariate normality and include: • Graphical Methods • Back-of-envelope Tests • Some Historical Tests • Diagnostic Tests
Graphical Tests • Graphical Methods • The Normal Quantile-Quantile (Q-Q) plot - constructed by plotting the empirical quantiles of the data against corresponding quantiles of the normal distribution. • Kernel Density Plot - Plot of the approximation a hypothesized probability density function from the observed data. • The probability-probability plot (P-P plot or percent plot - Compares an empirical cumulative distribution function of a variable with a specific theoretical cumulative distribution function (e.g., the standard normal distribution function)
More Graphical Tests • Graphical Methods • Histogram plot of the data • A box-plot of the data should indicate the nature of skewness of the data. • Stem-and-Leaf Plot
Fast-and-Easy Tests • Back-of-envelope Tests • Using the sample maximum and minimum values, computes their z-score, and compare to the 68–95–99.7 rule:
Historically Relevant Tests • Some Historical Tests • The third and fourth standardized moments (skewness and kurtosis) were some of the earliest tests for normality. • Other early test statistics include the ratio of the mean absolute deviation to the standard deviation OR • The ratio of the range to the standard deviation.
Diagnostic Tests • Diagnostic Tests • D'Agostino's K-squared test, • Jarque–Bera test, • Anderson–Darling test, • Cramér–von Mises criterion, • Lilliefors test for normality • Kolmogorov–Smirnov test), • Shapiro–Wilk test, • Pearson's chi-squared test, and • Shapiro–Francia test. • More recent tests include: • The energy test • Tests based on the empirical characteristic function like those by Henzeand Zirkler, and the BHEP tests.
Choosing Between Parametric and Non-Parametric Tests: Does it Matter? • Does it matter whether you choose a parametric or nonparametric test? The answer depends on sample size. There are four cases to think about:
Choosing Between Parametric and Non-Parametric Tests: Does it Matter? • Using a parametric test with data from a Non-Normal population when sample sizes are large: • The central limit theorem ensures that parametric tests work well with large samples even if the population is non-Gaussian. That is, parametric tests are robust to deviations from Normal distributions, so long as the samples are large. • It is impossible to say how large is large enough. • Nonparametric tests work well with large samples from Normal populations. • The P values tend to be a bit too large, but the discrepancy is small. In other words, nonparametric tests are only slightly less powerful than parametric tests with large samples.
Choosing Between Parametric and Non-Parametric Tests: Does it Matter? • For small samples • You can't rely on the central limit theorem, so the P value may be inaccurate. • In a nonparametric test with data from a Gaussian population, the p - values tend to be too high. • The nonparametric tests lack statistical power with small samples.
Choosing Between Parametric and Non-Parametric Tests: Does it Matter? • Does it matter whether you choose a parametric or nonparametric test? • Large data sets present no problems. • Small data sets present a dilemma.
Assume that your data have an underlying continuous distribution. Assume that for groups being compared, their parent distributions are similar in all characteristics other than location. Are usually less sensitive than parametric methods. Are often more robust than parametric methods when their assumptions are properly met. Can run into problems when there are many ties (data with the same value). That take into account the magnitude of the difference between categories (e.g. Wilcoxon signed ranks test) are more powerful than those that do not (e.g. sign test). Non-Parametric Tests…
It depends on the level of measurement obtained (nominal, ordinal, or interval), the power of the test, whether samples are related or independent, number of samples, availability of software support (e.g. SPSS) Related samples are usually referred to match-pair (using randomization) samples or before-after samples. Other cases are usually treated as independent samples. For instance, in a survey using random sampling, we have a sub-sample of males and a sub-sample of females. They can be considered as independent samples as they are all randomly selected. Choice of Non-Parametric Test
Binomial– tests whether the observed distribution of dichotomous variable (a variable that has two values only) is the same as that expected from a given binomial distribution. The default value of p is 0.5.You can change the value of p. For example, a couple has given birth consecutively 8 baby girls, and you would like to test if their probability of given birth to baby girls is > 0.6 or >0.7, you can test the hypothesis by changing the default value of p in the SPSS programme. One-sample case
Kolmogorov-Smirnov– Compares the distribution of a variable with a uniform, normal, Poisson, or exponential distribution, Null hypothesis: the observed values were sampled from a distribution of that type. One Sample Test Continued
Runs A run is defined as a sequence of cases on the same side of the cut point. (An uninterrupted course of some state or condition, for e.g. a run of good luck). You should use the Runs Test procedure when you want to test the hypothesis that the values of a variable are ordered randomly with respect to a cut point of your choosing (Default cut point: median. More One Sample Tests
Example: If you ask 20 students about how well they understand a lecture on a scale ranged from 1 to 5 (and the median in the class is 3). If you find that, the first 10 students give a value higher than 3 and the second 10 give a value lower than 3 (there are only 2 runs). 5445444545 2222112211 For random situation, there should be more runs (but will not be close to 20, which means they are ordered exactly in an alternative fashion; for example a value below 3 will be followed by one higher than it and vice versa). 2,4,1,5,1,4,2,5,1,4,2,4 The Runs Test is often used as a precursor to running tests that compare the means of two or more groups, including: The Independent-Samples T Test procedure. The One-Way ANOVA procedure. The Two-Independent-Samples Tests procedure. The Tests for Several Independent Samples procedure.
Runs Test siblings Test Valuea 1.00 Cases < Test Value 4 Cases >= Test Value 36 Total Cases 40 Number of Runs 7 Z -.654 Asymp. Sig. (2-tailed) .513 a. Median
McNemar– tests whether the changes in proportions are the same for pairs of dichotomous variables. McNemar’s test is computed like the usual chi-square test, but only the two cells in which the classification don’t match are used. Null hypothesis: People are equally likely to fall into two contradictory classification categories. Sample cases (Related Samples)
Sign test– tests whether the numbers of differences (+ve or –ve) between two samples are approximately the same. Each pair of scores (before and after) are compared. When “after” > “before” (+ sign), if smaller (- sign). When both are the same, it is a tie. Sign-test did not use all the information available (the size of difference), but it requires less assumptions about the sample and can avoid the influence of the outliers. Related Sample Cases
To test the association between the following two perceptions Social workers help the disadvantaged and Social workers bring hopes to those in averse situation Sign Test
Wilcoxon matched-pairs signed-ranks test – Similar to sign test, but take into consideration the ranking of the magnitude of the difference among the pairs of values. (Sign test only considers the direction of difference but not the magnitude of differences.) The test requires that the differences (of the true values) be a sample from a symmetric distribution (but not require normality). It’s better to run stem-and-leaf plot of the differences. More Related Sample Cases
Mann-Whitney U – similar to Wilcoxon matched-paired signed-ranks test except that the samples are independent and not paired. It’s the most commonly used alternative to the independent-samples t test. Null hypothesis: the population means are the same for the two groups. The actual computation of the Mann-Whitney test is simple. You rank the combined data values for the two groups. Then you find the average rank in each group. Requirement: the population variances for the two groups must be the same, but the shape of the distribution does not matter. Two-sample case (independent samples)
Kolmogorov-Smirnov Z– to test if two distributions are different. It is used when there are only a few values available on the ordinal scale. K-S test is more powerful than M-W U test if the two distributions differ in terms of dispersion instead of central tendency. Two Independent Sample Cases
Wald-Wolfowitz Run– Based on the number of runs within each group when the cases are placed in rank order. Moses test of extreme reactions – Tests whether the range (excluding the lowest 5% and the highest 5%) of an ordinal variables is the same in the two groups. More Two Independent Sample Cases
Kruskal-Wallis One-way ANOVA– It’s more powerful than Chi-square test when ordinal scale can be assumed. It is computed exactly like the Mann-Whitney test, except that there are more groups. The data must be independent samples from populations with the same shape (but not necessarily normal). K-sample case (Independent samples)
Friedman two-way ANOVA – test whether the k related samples could probably have come from the same population with respect to mean rank. K Related samples