Statistical Methods for Data Analysis in Physics Experiments
170 likes | 250 Vues
Learn about systematic errors, LHR methods, uncertainties, hypotheses testing, and classification tasks in particle physics data analysis. Understand how to extract signals from background using discriminating variables efficiently.

Statistical Methods for Data Analysis in Physics Experiments
E N D
Presentation Transcript
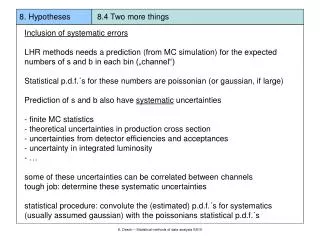
8. Hypotheses 8.4 Two more things • Inclusion of systematic errors • LHR methods needs a prediction (from MC simulation) for the expected • numbers of s and b in each bin („channel“) • Statistical p.d.f.´s for these numbers are poissonian (or gaussian, if large) • Prediction of s and b also have systematic uncertainties • finite MC statistics • theoretical uncertainties in production cross section • uncertainties from detector efficiencies and acceptances • uncertainty in integrated luminosity • … • some of these uncertainties can be correlated between channels • tough job: determine these systematic uncertainties • statistical procedure: convolute the (estimated) p.d.f.´s for systematics • (usually assumed gaussian) with the poissonians statistical p.d.f.´s K. Desch – Statistical methods of data analysis SS10
8. Hypotheses 8.4 Two more things (rather) easy-to-userootclass Tlimit() public: TLimit() TLimit(constTLimit&) virtual ~TLimit() staticTClass* Class() staticTConfidenceLevel* ComputeLimit(TLimitDataSource* data, Int_tnmc = 50000, boolstat = false, TRandom* generator = 0) staticTConfidenceLevel* ComputeLimit(Double_t s, Double_t b, Int_t d, Int_tnmc = 50000, boolstat = false, TRandom* generator = 0) staticTConfidenceLevel* ComputeLimit(TH1* s, TH1* b, TH1* d, Int_tnmc = 50000, boolstat = false, TRandom* generator = 0) staticTConfidenceLevel* ComputeLimit(Double_t s, Double_t b, Int_t d, TVectorD* se, TVectorD* be, TObjArray*, Int_tnmc = 50000, boolstat = false, TRandom* generator = 0) staticTConfidenceLevel* ComputeLimit(TH1* s, TH1* b, TH1* d, TVectorD* se, TVectorD* be, TObjArray*, Int_tnmc = 50000, boolstat = false, TRandom* generator = 0) onlyneedsvectorsofsignal, background, observeddata (and theirerrors) and computes (e.g.) CLb, CLs+b,CLs, exptectedCLb, CLs+b,CLs and muchmore… K. Desch – Statistical methods of data analysis SS10
8. Hypotheses 8.4 Two more things The „look elsewhere“ effect The LHR test is a „either-or“ test of two hypotheses (e.g. „Higgs at 114 GeV“ or „no Higgs at 114 GeV“) When the question of a discovery of a new particle is asked, often many „signal“ hypotheses are tested against the background hypothesis simultaneously (e.g. m=105, m=108, m=111, m=114, …) The probability that any of these hypotheses yields a „false-positve“ result is larger than the probability for a single hypothesis to be false-positive This is the „look elsewhere“ effect If the probabilites are small, the 1-CLb can simply be multiplied by the number of different hypotheses that are tested simultaneously In case there is continous „test mass“ in principle infinitely many hypotheses are tested – but they are correlated (excess for mtest = 114 will also cause excess for mtest = 114.5) K. Desch – Statistical methods of data analysis SS10
8. Hypotheses 8.4 Two more things The „look elsewhere“ effect (ctd.) need an „effective“ number of tested hypotheses hard to quantify exactly Ansatz: two hypotheses are uncorrelated if their reconstructed mass distributions do not overlap Estimate: effective number of hypotheses = range of test masses / average mass resolution K. Desch – Statistical methods of data analysis SS10
9. Classification Task: how to find needles in haystacks? how to enrich a sample of events with „signal-like“ events? Why is it important? Only one out of 1011 LHC events contains a Higgs (decay) if it exists. Existence („discovery“) can only be shown if a statistically significant excess can be extracted from the data Most particle physics analyses require separation of a signal from background(s) based on a set of discriminating variables K. Desch – Statistical methods of data analysis SS10
9. Classification • Different types of input information (discriminating variables) • multivariate analysis • Combine these variables to extract the maximum of discriminating power • between signal and background • Kinematic variables (masses, momenta, decay angles, …) • Event properties (jet/lepton multiplicity, sum of charges, …) • Event shape (sphericity, …) • Detector response (silicon hits, dE/dx, Cherenkov angle, shower profiles, …) • etc. K. Desch – Statistical methods of data analysis SS10
x2 x2 x2 H1 H1 H1 H0 H0 H0 x1 x1 x1 9. Classification Suppose data sample with two types of events:H0, H1 We have found discriminating input variables x1, x2, … What decision boundary should we use to select events of type H1? Rectangular cuts Linear boundary Nonlinear boundary(ies) K. Desch – Statistical methods of data analysis SS10
9. Classification [H.Voss] K. Desch – Statistical methods of data analysis SS10
9. Classification [H.Voss] K. Desch – Statistical methods of data analysis SS10
9. Classification [H.Voss] K. Desch – Statistical methods of data analysis SS10
9. Classification [H.Voss] K. Desch – Statistical methods of data analysis SS10
9. Classification [H.Voss] K. Desch – Statistical methods of data analysis SS10
9. Classification [H.Voss] K. Desch – Statistical methods of data analysis SS10
9. Classification [H.Voss] K. Desch – Statistical methods of data analysis SS10
9. Classification MVA algorithms Finding the optimal Multivariate Analysis (MVA) algorithm is not trivial Large variety of different algorithms exist K. Desch – Statistical methods of data analysis SS10
9. Classification (Projective) Likelihood-Selection [H.Voss] K. Desch – Statistical methods of data analysis SS10
9. Classification (Projective) Likelihood-Selection [H.Voss] K. Desch – Statistical methods of data analysis SS10