Download

1 / 10
100 likes | 118 Vues
Measurement of lead-tungstate detector performance for Laser-Wire experiment calibration and simulation. Experimental setup, electronics, data acquisition, detector performance evaluation, control tests, conclusions drawn.

E N D
FLC Group Test-beam Studies of the Laser-Wire Detector 13 September 2006 Maximilian Micheler Supervisor: Freddy Poirier
Introduction The goal of the Test-Beam Studies is to measure the performance of the lead-tungstate detector used at the Laser-Wire experiment at PETRA II: → Calibration, for the use of the detector at the Laser-Wire experiment → Resolution, mainly for simulation purposes
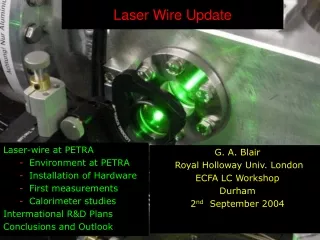
Experimental setup • Detector is placed in line with the electron beam as to achieve an EM shower in the centre of the lead-tungstate crystal. (achieved by mounting the detector on an adjustable table) • Hamamatsu R6236 photomultiplier tube (54mmx54mm active photo cathode surface) for detection of the energy dissipation in the crystal • Two scintillators (one horizontal and one vertical scintillator) were placed in front of the detector and connected to a coincidence unit to only record signals for electrons which entered the crystal in the centre • The electron beam energies were selected by changing the currents in the magnets using a computer with a provided software in the Test-beam 24 control room.
Electronics • Scintillator signal processed using: • Amplifier • Discriminator • Coincidence unit • TTL signal converter • TTL signal used for triggering integration of PMT output signal. • Using a Computer (ADC Break-out box in the figure) and an integrator card to integrate the PMT signal and to record the area. • The setup of the test-beam studies was chosen to have the same conditions as in the Laser-Wire Hut: • Identical electronics for the read-out system, i.e. ADC box and integrator card • Similar timing for read-out system
Data Acquisition • Signal from PMT is a negative voltage peak. • Integrator card integrates this peak and outputs the area as a positive voltage which is recorded by the computer. • For every single beam energy and PMT supply voltage around 1000 integrator card voltages have been measured. • The 1000 area measurements were plotted on a histogram and fitted with a Gaussian function • The two graphs are taken for a PMT supply voltage of 1115V at a beam energy of 3.6GeV • Mean, Standard deviation,and Errors on the Standard deviation from Gaussian function
Detector Performance • Calibration plot: the mean of the integrated signal against the corresponding beam energy for the 4 different PMT supply voltages • This calibration plot was expected to show a lineardependence of the integrated signal on the beam energy • Linear fittings of the individual data sets show a non-linear behaviour Calibration plot • Resolution plot: the PMT normalised resolution (Gaussian width/integrated signal) against the beam energy • Resolution is expected to decrease with increasing beam energy. • At a PMT supply voltage of 1300V this is not the case Resolution plot
Control Tests • Possible reasons why the results differ from expectation: • Saturation of PMT • Cutting the signal • → Incorrect delay • →Incorrect integration width • Saturation of the read-out system • Investigation of the raw PMT output signal recorded from the oscilloscope (as shown). The following quantities were directly calculated from the raw signal: • Signal amplitude (difference between constant base line and minimum voltage) • Signal area (sum of the relative signal w.r.t. the base line within the integration range)
Control Tests – PMT saturation effects • Plot of signal amplitude against signal area shows a linear dependence: • Fit: y = 0.0274x + 0.0474 • where y represents the signal amplitude and x the signal area. • Plot of signal amplitude against beam energy shows a linear dependence: • Fit: y = 0.404x + 0.076 • where y represents the signal amplitude and x the beam energy. • Therefore the signal area also shows a linear dependence on the beam energy • → No detector saturation while increasing the beam energy
Control Tests – Cut-off effects • 1μs integration delay w.r.t. the TTL trigger, 2.4μs integration width • The two graphs show a integration with an asymmetric cut-off of the signal from the tail and the front of the PMT raw signal, respectively. • Signal area decreases due to cut-off. However, the plots of the signal area against the beam energy for the different cut-off points are still linear. • → Cut-off effects do not seem to be responsible for the non-linear characteristics of the integrated signal • →No cut-off effects due to integration width as width is sufficiently long enough to detect entire signal (width approx. 110ns) tail front
Control Tests – Read-out system saturation At the present time, the read-out system is under study to check how it performs with voltages higher than it is designed for. Conclusions • Resolution plot and Calibration plot achieved for the Laser-Wire detector • Results used for calibration of the signal at the Laser-Wire experiment • After the calibration the data from the Laser-Wire experiment will be compared with previous simulations