Engaging Linear Functions Lesson: Graphing and Relations in a Human Coordinate Grid
This dynamic lesson on linear functions immerses students in active learning through a human-sized coordinate grid game. Students will graph linear equations using their own locations as points, making the math tangible and relatable. The lesson targets objectives related to identifying, graphing, and understanding linear equations, with a focus on slope and the concepts of domain and range. The activity not only encourages hands-on participation but also reinforces essential vocabulary and mathematical relationships in a fun and interactive way.

Engaging Linear Functions Lesson: Graphing and Relations in a Human Coordinate Grid
E N D
Presentation Transcript
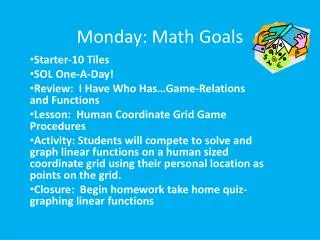
Monday: Math Goals Starter-10 Tiles SOL One-A-Day! Review: I Have Who Has…Game-Relations and Functions Lesson: Human Coordinate Grid Game Procedures Activity: Students will compete to solve and graph linear functions on a human sized coordinate grid using their personal location as points on the grid. Closure: Begin homework take home quiz-graphing linear functions
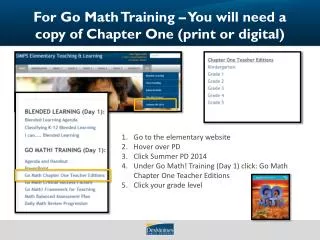
Linear Functions Chapter 7-3 Standards AF 3.3 & AF 1.1 Objective: to identify and graph linear equations.
Vocabulary linear equation linear function
y 6 4 Miles 2 x 0 0 2 4 Hours A linear equation is an equation whose graph is a line. The solutions of a linear equation are the points that make up its graph. Linear equations and linear graphs can be different representations of linear functions. A linear function is a function whose graph is a nonvertical line.
Only two points are needed to draw the graph of a linear function. However, graphing a third point serves as a check. You can use a function table to find each ordered pair.
Graph the linear function y = 4x - 1. Input Ordered Pair Rule Output x 4x – 1 y (x, y) 0 4(0) – 1 –1 (0, –1) 1 4(1) – 1 (1, 3) 3 –1 –5 4(–1) – 1 (–1, –5)
y 4 2 x 0 –2 2 4 –4 –2 –4 Graph the linear function y = 4x - 1. (1, 3) Place each ordered pair on the coordinate grid and then connect the points with a line. (0, –1) (–1, –5)
y x Graph the linear function y = 3x + 1. (1, 4) 4 Place each ordered pair on the coordinate grid and then connect the points with a line. 2 (0, 1) 0 –2 2 4 –4 (–1, –2) –2 –4
Dogs are considered to age 7 years for each human year. If a dog is 3 years old today, how old in human years will it be in 4 more years? Write a linear equation which would show this relationship. Then make a graph to show how the dog will age in human years over the next 4 years. Begin by making a function table. Include a column for the rule.
4-6 Graphing Linear Functions Course 2 Insert Lesson Title Here Check It Out: Example 2 Continued y 7(x) + 21 x Multiply the input by 7 and then add 21. 7(0) + 21 21 0 2 7(2) + 21 35 49 7(4) + 21 4 Let x represent the input and y represent the output. The function is y = 7x + 21, where x is the number of years and y is the total age of the dog in human years.
y 80 60 40 20 0 2 4 8 10 Graph the ordered pairs (0, 21), (2, 35), and (4, 49) from your table. Connect the points with a line. Human Year x Years
Lesson Quiz Graph the linear functions. 1.y = 3x – 4 2.y = –x + 4 3.y = 2 y = –x +4 y = 2 y = 3x – 4
Tuesday: Math Goals • Starter • SOL One-A-Day • Homework Huddle-Collect Quiz • Lesson: Domain and Range • Activity: Spaghetti Bridges • HW: Domain Range Activity
y y2 y1 x x1 x2 Slope of a Line
Definition of Slope • The slope of the line is it’s measure of steepness. It measures the rate of changeof the line. In all lines the slope is constant, it doesn’t change no matter where you are at on the line.
Bicycles In groups, generate the line that relates the number of wheels to the number of bicycles. Represent it Graphically. What does the slope of this line represent?
Intercepts • Where the graph crosses the x-axis is the x-intercept. It has coordinates (a,0). • Where the graph crosses the y-axis is the y-intercept. It has coordinates (0,b).
The x and y intercepts of a line y y-intercept (0,b) x-intercept x (a,0)
Example • Find the x and y intercepts of the line given by:
Any stinkingpoint on the line y-intercept Slope Intercept Form y x
Any stinkingpoint on the line Any stinking fixedpoint on the line Point Slope Form y x
Slope Formula Slope Intercept Form Point Slope Form Line Formulas
Definition of Function or How to Relate
Relation • 32 mpg • 8 mpg • 16 mpg (A) (B) (C)
Domain and Range • The values that make up the set of independent values are the domain • The values that make up the set of dependent values are the range. • State the domain and range from the 4 examples of relations given.
CorrespondenceorRelation Domain Range
Definition of a Relation • A Relation maps a value from the domain to the range. A Relation is a set of ordered pairs. • The most common types of relations in algebra map subsets of real numbers to other subsets of real numbers.
Definition of a Function • If a relation has the additional characteristic that each element of the domain is mapped to one and only one element of the range then we call the relation a Function.
Definition of a Function • If we think of the domain as the set of boys and the range the set of girls, then a function is a monogamous relationship from the domain to the range. Each boy gets to go out with one and only one girl. • But… It does not say anything about the girls. They get to live in Utah.
Decide if the Relation is a Function. • The relation is the year and the cost of a first class stamp. • The relation is the weight of an animal and the beats per minute of it’s heart. • The relation is the time of the day and the intensity of the sun light. • The relation is a number and it’s square. • The relation is time since you left your house for work and your distance from home.
Examples Please • Give three examples from the real world of relations. Be sure and state the domain, the range, and the definition of how the variables are related. • Decide which if any of your examples are functions.
y1 y2 RANGE NOT A FUNCTION R x DOMAIN
x1 y x2 RANGE DOMAIN FUNCTION f
X Y 1 1 -5 1 -1 1 3 1 X Y 1 2 -5 7 -1 2 3 3 X Y 1 2 1 7 1 2 1 3 X Y 1 π π 1 -1 5 π 3 Mathematical Examples • Decide if the following relations are functions.
X Y 1 2 5 10 -1 -2 3 6 Ways to Represent a Function • Graphical • Symbolic • Numeric • VerbalThe cost is twice the original amount.
Function NotationThe Symbolic Form • A truly excellent notation. It is concise and useful.
Name of the function • Output Value• Member of the Range• Dependent Variable These are all equivalent names for the y. • Input Value• Member of the Domain• Independent Variable These are all equivalent names for the x.
Examples of Function Notation • The f notation • Find f(2), g(-1), f(-0.983),
Your Turn! Given: Evaluate the following: