Download
1 / 43
490 likes | 809 Vues
Ocean circulation and coupling with the atmosphere Arnaud Czaja 1. Ocean heat storage & transport 2. Key observations 3. Ocean heat uptake and global warming 4. Mechanisms of ocean-atmosphere coupling. Part I Ocean heat storage and transport. Net energy loss at top-of-the atmosphere. =. +.

E N D
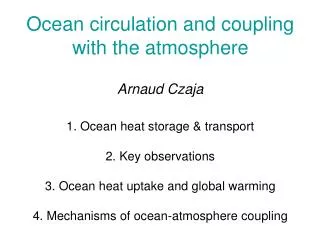
Ocean circulation and coupling with the atmosphereArnaud Czaja1. Ocean heat storage & transport2. Key observations3. Ocean heat uptake and global warming4. Mechanisms of ocean-atmosphere coupling
Net energy loss at top-of-the atmosphere = + Poleward energy transport Ha Ho Imbalance between and = energy (heat) storage
Poleward heat transport and storage are small… Energy exchanged at top-of-atmosphere : Planetary albedo Solar constant
Sometimes effects of heat storage and transport are hard to disentangle • Is the Gulf Stream responsible for “mild” European winters?
WARM! COLD! Eddy surface air temperature from NCAR reanalysis (January, CI=3K) “Every West wind that blows crosses the Gulf Stream on its way to Europe, and carries with it a portion of this heat to temper there the Northern winds of winter. It is the influence of this stream upon climate that makes Erin the “Emerald Isle of the Sea”, and that clothes the shores of Albion in evergreen robes; while in the same latitude, on this side, the coasts of Labrador are fast bound in fetters of ice.” Maury, 1855. Lieutenant Maury “The Pathfinder of the Seas”
Model set-up (Seager et al., 2002) • Full Atmospheric model • Ocean only represented as a motionless “slab” of 50m thickness, with a specified “q-flux” to represent the transport of energy by ocean currents Atmosphere
Q3 Seager et al. (2002)
Q5 Broecker, 2005 NB: 1 Amazon River ≈ 0.2 Million m3/s
In – situ velocity measurements Amplitude of time variability Location of “long” (~2yr) currentmeters Depth NB: Energy at period < 1 day was removed From Wunsch (1997, 1999)
Moorings in the North Atlantic interior (28N, 70W = MODE) 1 yr NB: Same velocity vectors but rotated Schmitz (1989)
Direct ship observations NB: 1m/s = 3.6kmh = 2.2mph = 1.9 knot
Surface currents measured from Space “Geostrophic balance” Standard deviation of sea surface height Time mean sea surface height
10-yr average sea surface height deviation from geoid Subtropical gyres
10-yr average sea surface height deviation from geoid Subpolar gyres Antarctic Circumpolar Current
ARGO floats (since yr 2000) T/S/P profiles every 10 days Coverage by lifetime Coverage by depths
All in-situ observations can be interpolated dynamically using numerical ocean models Overturning Streamfunction (Atlantic only) From Wunsch (2000)
RAPID – WATCH array at 26N 14 millions £
Part IIIOcean heat uptake and anthropogenic forcing of climate change
Heat storage and Climate change The surface warming due to +4Wm-2 (anthropogenic forcing) is not limited to the mixed layer. Heat exchanges between the mixed layer and deeper layers control the timescale of the surface warming.
Weak vertical ocean heat transport Anthropogenic forcing Net surface ocean heating Upper ocean cooling via mass exchange with deep ocean Upper ocean cooling via diabatic processes
Large vertical ocean heat transport Anthropogenic forcing Net surface ocean heating Upper ocean cooling via diabatic processes Upper ocean cooling via mass exchange with deep ocean
Atmosphere Extra Tropics Ocean Tropics The Environmental Physics Climate Model TA1 Heat content (J) http://www.sp.ph.ic.ac.uk/~aczaja/EP_ClimateModel.html
Upper (0-750m) ocean heat content vs TOA imbalance: observations Wong et al (2006)
Mechanisms of heat exchange between upper and deep layers • Wind driven circulation pumping down of warm subtropical waters; upwelling of cold, high latitude waters. • Buoyancy driven circulations sinking of dense water and upwelling of light water (= overturning circulations + eddy driven + convection). • Mixing isopycnal diffusion and breaking internal gravity waves. Q1
Ocean heat uptake in wind driven gyres • Global downward ocean heat transport driven by winds. • Strength: Williams & Follows (2012) Levitus (1988)
Buoyancy driven circulations and ocean heat uptake : Cooling • Total temperature change in the 10th decade after 2XCO2 (idealised ocean basin) • Temperature change due to change in ocean currents • Temperature change in absence of change in ocean currents. Xie and Vallis (2011)
Interior mixing & ocean heat uptake Upward heat flux Osborne (1998) +100 Vertical heat flux (Wm-2) deeper Downward heat flux -100 South Pole Equator North Pole
Motions in the ocean are not isotropic: “neutral” surfaces • In the simplest case of a waterworld at rest, a fluid parcel does work against the buoyancy force when displaced upward or downward. Motions along z=cst are energetically neutral. Z=h Z=0 Solid Earth where Reference density
Motions in the ocean are not isotropic: “neutral” surfaces • In the real ocean, neutral surfaces take the shape of a bowl due to the distortion of spheres by the seafloor topography, surface heating, cooling and winds. Neutral surfaces in the Atlantic NB: These surfaces can be approximated as surfaces of constant density (“isopycnals”). Neutrally energetic displacements WOCE A16