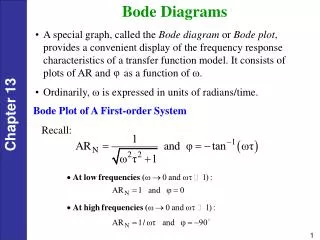
BODE DIAGRAMS
BODE DIAGRAMS. Osman Parlaktuna Osmangazi University Eskisehir, TURKEY www.ogu.edu.tr/~oparlak. MAGNITUDE AND PHASE PLOTS. A Bode diagram is a graphical technique that gives a feel for the frequency response of a circuit. It consists of two separate plots: |H(jw)| versus w


BODE DIAGRAMS
E N D
Presentation Transcript
BODE DIAGRAMS Osman Parlaktuna Osmangazi University Eskisehir, TURKEY www.ogu.edu.tr/~oparlak
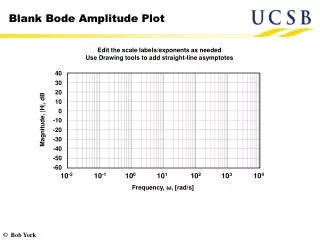
MAGNITUDE AND PHASE PLOTS • A Bode diagram is a graphical technique that gives a feel for the frequency response of a circuit. • It consists of two separate plots: • |H(jw)| versus w • Phase angle of H(jw) versus w. • The plots are made on semilog graph paper to represent the wide range of frequency values. The frequency is plotted on the horizontal log axis, and the amplitude and phase angle are plotted on the linear vertical axis. Circuit Analysis II Spring 2005 Osman Parlaktuna
SEMILOG PAPER Circuit Analysis II Spring 2005 Osman Parlaktuna
Real, First-Order Poles and Zeros Consider the following transfer function where all the poles and zeros are real and first-order The first step is to put H(jw) in a standard form as: Circuit Analysis II Spring 2005 Osman Parlaktuna
The Bode diagram consists of plotting |H(jw)| and θ(w) as functions of w. Circuit Analysis II Spring 2005 Osman Parlaktuna
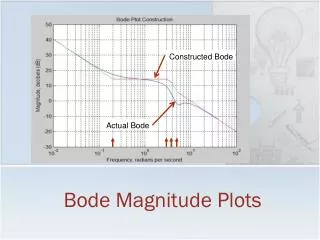
STRAIGHT-LINE AMPLITUDE PLOTS The amplitude plot involves the multiplication and division of factors associated with the poles and zeros of H(s). This multiplication and division is reduced to addition and subtraction by expressing |H(jw)| in terms of a logarithmic value: the decibel (dB). The amplitude of H(jw) in decibels is For the transfer function H(s) in the example The key point is to plot each term separately and then combine the separate plots graphically. Circuit Analysis II Spring 2005 Osman Parlaktuna
1) The plot of 20log10K0 is a horizontal line because K0 is not a function of frequency. The value of this term is positive if K0>1, zero for K0=1, and negative for K0<1. 2) Two straight lines approximate the plot of 20log10|1+jw/z1|. For small values of w, the magnitude |1+jw/z1| is approximately 1, and therefore 20log10|1+jw/z1| 0 as w 0. For large values of w, the magnitude |1+jw/z1| is approximately (w/z1), and therefore 20log10|1+jw/z1| 20log10(w/z1) as w ∞. On a log scale, 20log10(w/z1) is a straight line with a slope of 20dB/decade (a decade is a 10-to-1 change in frequency). This straight line intersects the 0dB axis at w=z1. This value of w is called the corner frequency. Circuit Analysis II Spring 2005 Osman Parlaktuna
Circuit Analysis II Spring 2005 Osman Parlaktuna
3) The plot of -20log10w is a straight line having a slope of -20dB/decade that intersects the 0 dB axis at w=1. Circuit Analysis II Spring 2005 Osman Parlaktuna
Two straight lines approximate the plot of 20log10|1+jw/p1|. Two straight lines intersect on the 0 dB axis at w=p1. For large values of w, the straight line has a slope of -20dB/decade. Circuit Analysis II Spring 2005 Osman Parlaktuna
Magnitude Bode plot of -- 20log10(1+jw/0.1) -- -20log10(1+jw/5) -- -20log10(w) -- 20log10(√10) -- 20log10|H(jw)| Circuit Analysis II Spring 2005 Osman Parlaktuna
EXAMPLE 110mH 10mF + vi + vo 11Ω Circuit Analysis II Spring 2005 Osman Parlaktuna
Circuit Analysis II Spring 2005 Osman Parlaktuna
Calculate 20log10 |H(jw)| at w=50 rad/s and w=1000 rad/s Circuit Analysis II Spring 2005 Osman Parlaktuna
Using the Bode diagram, calculate the amplitude of vo if vi(t)=5cos(500t+150)V. From the Bode diagram, the value of AdB at w=500 rad/s is approximately -12.5 dB. Therefore, Circuit Analysis II Spring 2005 Osman Parlaktuna
MORE ACCURATE AMPLITUDE PLOTS The straight-line plots for first-order poles and zeros can be made more accurate by correcting the amplitude values at the corner frequency, one half the corner frequency, and twice the corner frequency. The actual decibel values at these frequencies In these equations, + sign corresponds to a first-order zero, and – sign is for a first-order pole. Circuit Analysis II Spring 2005 Osman Parlaktuna
Circuit Analysis II Spring 2005 Osman Parlaktuna
STRAIGHT-LINE PHASE ANGLE PLOTS • The phase angle for constant Ko is zero. • The phase angle for a first-order zero or pole at the origin is a constant ± 900. • For a first-order zero or pole not at the origin, • For frequencies less than one tenth the corner frequency, the phase angle is assumed to be zero. • For frequencies greater than 10 times the corner frequency, the phase angle is assumed to be ± 900. • Between these frequencies the plot is a straight line that goes from 00 to ± 900 with a slope of ± 450/decade. Circuit Analysis II Spring 2005 Osman Parlaktuna
Circuit Analysis II Spring 2005 Osman Parlaktuna
EXAMPLE Circuit Analysis II Spring 2005 Osman Parlaktuna
Circuit Analysis II Spring 2005 Osman Parlaktuna
Compute the phase angle θ(w) at w=50, 500, and 1000 rad/s. Compute the steady-state output voltage if the source voltage is given by vi(t)=10cos(500t-250) V. Circuit Analysis II Spring 2005 Osman Parlaktuna
COMPLEX POLES AND ZEROS Circuit Analysis II Spring 2005 Osman Parlaktuna
AMPLITUDE PLOTS Thus, the approximate amplitude plot consists of two straight lines. For w<wn, the straight line lies along the 0 dB axis, and for w>wn, the straight line has a slope of -40 dB/decade. Thes two straight lines intersect at u=1 or w=wn. Circuit Analysis II Spring 2005 Osman Parlaktuna
Circuit Analysis II Spring 2005 Osman Parlaktuna
Correcting Straight-Line Amplitude Plots • The straight-line amplitude plot can be corrected by locating • four points on the actual curve. • One half the corner frequency: At this frequency, the actual amplitude is • The frequency at which the amplitude reaches its peak value. The amplitude peaks at and it has a peak amplitude • At the corner frequency, • The corrected amplitude plot crosses the 0 dB axis at Circuit Analysis II Spring 2005 Osman Parlaktuna
Circuit Analysis II Spring 2005 Osman Parlaktuna
When ζ>1/√2, the corrected amplitude plot lies below the straight line approximation. As ζ becomes very small, a large peak in the amplitude occurs around the corner frequency. Circuit Analysis II Spring 2005 Osman Parlaktuna
EXAMPLE 50mH 1Ω + vi + 8mf vo Circuit Analysis II Spring 2005 Osman Parlaktuna
Circuit Analysis II Spring 2005 Osman Parlaktuna
PHASE ANGLE PLOTS • For a second-order zero or pole not at the origin, • For frequencies less than one tenth the corner frequency, the phase angle is assumed to be zero. • For frequencies greater than 10 times the corner frequency, the phase angle is assumed to be ± 1800. • Between these frequencies the plot is a straight line that goes from 00 to ± 1800 with a slope of ± 900/decade. • As in the case of the amplitude plot, ζ is important in determining the exact shape of the phase angle plot. For small values of ζ , the phase angle changes rapidly in the vicinity of the corner frequency. Circuit Analysis II Spring 2005 Osman Parlaktuna
Circuit Analysis II Spring 2005 Osman Parlaktuna
ζ=0.1 ζ=0.3 ζ=0.707 Circuit Analysis II Spring 2005 Osman Parlaktuna
EXAMPLE 50mH + vi + 1Ω vo 40mf Circuit Analysis II Spring 2005 Osman Parlaktuna
Circuit Analysis II Spring 2005 Osman Parlaktuna
From the straight-line plot, this circuit acts as a low-pass filter. At the cutoff frequency, the amplitude of H(jw) is 3 dB less than the amplitude in the passband. From the plot, the cutoff frecuency is predicted approximately as 13 rad/s. To solve tha actual cutoff frequency, follow the procedure as: Circuit Analysis II Spring 2005 Osman Parlaktuna
wc Circuit Analysis II Spring 2005 Osman Parlaktuna
From the phase plot, the phase angle at the cutoff frequency is estimated to be -650. The exact phase angle at the cutoff frequency can be calculated as Note the large error in the predicted error. In general, straight-line phase angle plots do not give satisfactory results in the frequency band where the phase angle is changing. Circuit Analysis II Spring 2005 Osman Parlaktuna