Select Question
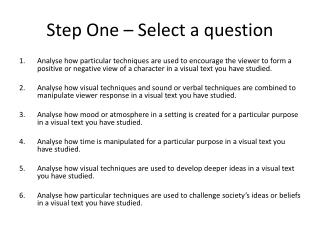
Explore research activities, hypothesis development, data analysis methods, and result communication. Learn to differentiate describing research from explaining results with practical examples.

Select Question
E N D
Presentation Transcript
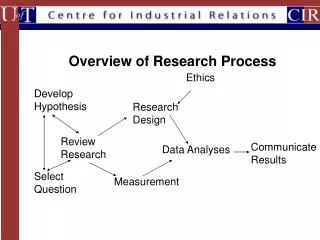
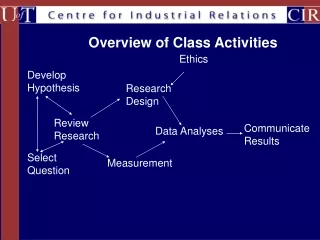
Overview of Class Activities Ethics Develop Hypothesis Research Design Review Research Communicate Results Data Analyses Select Question Measurement
Our Current Focus Develop Hypothesis “Describing the research” Activity “Choosing a Research Question” Activity Review Research PsycInfo Assignment Select Question
Describing the research • Examples • A journalist’s description of a study • Executive summary of a technical report • Abstract of an academic journal article • Let’s examine how they are • Different • Similar
Journalist description • Flynn studied 161 engineers working for a telecoms firm …They work in eight teams, but each individually sorts out detailed engineering problems sent in from around the country. (He) asked each employee to report how often they swapped help with each member of the team—help such as technical advice or taking a second look at a recommended solution—and who, in each case, had given relatively more in their exchanges. Thus, he looked separately at the frequency with which individual workers made such swaps and at how one-sidedly generous they were. He also asked employees to rate how highly they regarded one another.
Journalist description • (He) correlated the answers he got with information from the firm on employees' productivity. He found that generous employees who get little in exchange are well-regarded by colleagues. Employees who helped colleagues generously but did not receive help in exchange were less productive. Those who receive as well as give were relatively more productive, particularly those who helped each other most often. A pattern of frequent giving and receiving boosted both productivity and social standing.
Abstract in academic article • Data collected from 161 employees of a large firm suggest that perceived generosity is positively related to individual social status, but maintaining an equitable balance is positively related to individual productivity. Employees may address this dilemma by increasing how often they exchange favors rather than by seeking exchange equity. Frequent favor exchange was positively related to both status and productivity and strengthened the generosity-status and the balance-productivity relationships. Findings highlight the value of studying employees, particularly the favor exchange among peer frequency of exchange.
Describing is not explaining • E.g., Why should productivity rise when employees frequently swap help? Mr Flynn has two explanations. First, as employees learn more about the resources they can offer each other, they develop a more efficient pattern of requesting and giving help. Second, helpful employees learn to trust each other more, and so become willing to do bigger favours because they feel more sure about the likelihood of reciprocation. And, of course, it is nicer to work with helpful people than with the other sort
Describing with a diagram Productivity Frequency of Help Social Status
Explaining with a diagram Productivity Efficiency in resource exchange Information about others’ interests Frequency of Help Liking for helper Social Status
Describing vs. explaining • Describing = What occurred? • Explaining =Why it occurred?
Features of a description • The Variables measured in the study • The results: How the variables are related (i.e., the hypothesis) • Number & kind of participants
Examples of features of a description • Hypothesis, Variables & results • …perceived generosity is positively related to individual social status…Frequent favor exchange was positively related to both status and productivity • Description of participants • Data collected from 161 employees of a large firm..
One feature of a description • Hypothesis, Variables & results • …perceived generosity is positively related to individual social status…Frequent favor exchange was positively related to both status and productivity
What is a variable • Examples • Frequency of giving help • Productivity • Social Status
What is not a variable • e.g., Instructor gender • But gender breakdown of class is a variable • E.g., Address of the university • A non variable is something that does not change values
A second feature of a description • Hypothesis, Variables & results • …perceived generosity is positively related to individual social status…Frequent favor exchange was positively related to both status and productivity
What is a hypothesis • Examples • Frequent giving and receiving boosts productivity and social standing • Perceived generosity is positively related to social status
A Diagram of a Hypothesis Productivity Frequency of Help Social Status
What is not a hypothesis:A variable, a result • Examples • The level of frequent giving was high (i.e., a result) • The level of productivity (i.e., a variable) was low
Variables vs. Hypothesis vs. Results • A hypothesis is a guess about the way in which variables are related • A result is an empirical statement about whether the hypothesis was supported (i.e., whether the variables were related) • A result can also be an empirical statement about a variable
Features of a hypothesis • Must be empirically testable • At least two variables must be involved Sekaran, Saks
Examples of features of a hypothesis • Consider whether the following examples are empirically testable & involve two variables • The instructor’s gender is female • The level of productivity is high • Frequent giving and receiving boosts productivity and social standing
What we learned so far:Students answer orally using the Conference Board Paper Executive Summary Handout • Explaining • Describing • Variable • Hypothesis • Results
Types of Variables • Independent (Aka Predictor, Cause) • E.g., frequency of help, one-sidedness of help • Dependent (Aka Criterion, Effect) • E.g., productivity, perceived social status Sekaran, Saks
Examples of Independent & Dependent Variables A researcher thinks that smaller groups will be more cohesive than larger groups Independent variable = Group size Dependent variable = Level of cohesion Number of Group Members
Examples of Independent & Dependent Variables A researcher thinks that setting goals will increase the number of orders that are “upsized” at McBurger King Independent variable = Setting of goals (yes or no) Dependent variable = # of upsized orders Group type
Independent vs. dependent variable • The Independent variable is the variable that is assumed to explain changes in the value of the dependent variable • Ways to solidify the assumption • Type of independent variable: e.g., Gender, • Degree of control over independent variable : e.g., Group Size, Number of goals
What we learned so far..Students complete handouts & answer orally • From the descriptions of studies in the handouts, identify • Independent variables • Dependent variables
Types of Hypotheses • Null • E.g., There is no relationship between frequency of help and productivity • Alternative • E.g., There is a relationship between frequency of help and productivity
Types of alternative hypotheses • Non directional • E.g., There is a relationship between frequency of help and productivity • Directional • E.g., There is a positive relationship between frequency of help and productivity
What we learned so far..Students complete handouts & answer orally • From the descriptions of studies in the handouts, identify • Null hypotheses • Alternative Directional hypotheses • Alternative non directional hypotheses
Putting it all together….Students examine questionnaire completed in first day of class & answer orally • Illustrate the difference between • A dependent & independent variable • An alternate & null hypothesis • A directional & non directional hypothesis • A result & a hypothesis • A variable & a result
What’s next • During this week • Describing the research you found toward your project • In the next class • Ways you can solidify the assumption that the independent variable in your project explains the dependent variable