Maximizing Wheat Yield through Variable Rate Technology
Explore the evolution of Variable Rate Technology (VRT) in wheat farming, from early experiments to precision sensors. Discover how VRT can optimize N rates and improve grain yield. Collaborative research and applications with CIMMYT and Virginia Tech are highlighted.

Maximizing Wheat Yield through Variable Rate Technology
E N D
Presentation Transcript
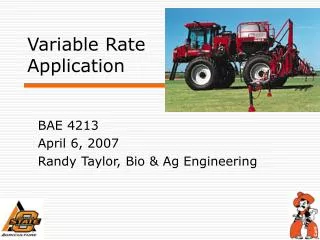
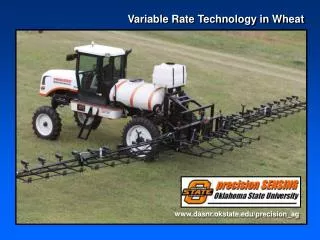
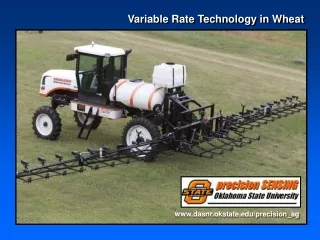
Variable Rate Technology in Wheat www.dasnr.okstate.edu/precision_ag
1993 Dr. Marvin Stone adjusts the fiber optics in a portable spectrometer used in early bermudagrass N rate studies with the Noble Foundation, 1994. Dr. John Solie, Dr. Marvin Stone, and Dr. Shannon Osborne collect sensor readings at ongoing bermudagrass, N rate * N timing experiments with the Noble Foundation in Ardmore, OK. Initial results were promising enough to continue this work in wheat.
Variable N rates using an inverse N-rate, NDVI scale were applied. N rates were cut in half with no differences in grain yield compared to fixed rates. Grain N uptake levels using VRT across a 70 meter transect were less variable when compared to the fixed rates (left). 1994 John Ringer and Shannon Osborne collected sensor readings and later applied variable N fertilizer rates based on an initial bermudagrass algorithm. Initial algorithms used to spatially treat N deficiencies in wheat and bermudagrass employed an inverse N Rate-NDVI scale.
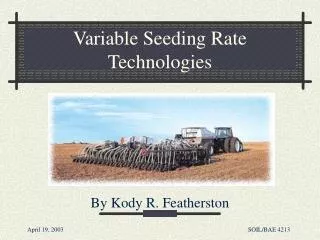
Samples were collected from every 1 square foot. These experiments helped to show that each 4ft2 in agricultural fields need to be treated as separate farms. 1995 Extensive field experiments looking at changes in sensor readings with changing, growth stage, variety, row spacing, and N rates were conducted. New ‘reflectance’ sensor developed.
Collaborative Project with CIMMYT Variety Selection/Yield PotentialSpring Wheat 1995
CIMMYT Date Location Personnel Objectives Feb, 1997 Ciudad Obregon TEAM-VRT Discuss potential collaborative work Jan, 1999 Obregon & Texcoco Steve Phillips, Joanne LaRuffa, IRSP 98, refine INSEY, 2- Wade Thomason, Sherry Britton, wheel tractor and wheat Joe Vadder, Gordon Johnson, bed planter design John Solie, Dick Whitney Sep, 1999 Texcoco Erna Lukina IRSP 98, use of EY as a selection tool Aug, 2000 Texcoco Marvin Stone, Kyle Freeman, IRSP 99, applications of Roger Teal, Robert Mullen, INSEY, sensor design Kathie Wynn, Carly Washmon, for plant breeding Dwayne Needham Jan-Mar 2001 Ciudad Obregon Kyle Freeman Joint collaboration on 200-03530 NRI Grant Apr 2001 Ciudad Obregon Kyle Freeman Wheat harvest July 2001 El Batan Jagadeesh Mosali, Shambel MogesMicah Humphreys, Paul Hodgen,Carly Washmon Wheat harvest Apr 2002 Ciudad Obregon Paul Hodgen NASA Grant TOTAL 8 26
In, March, 1996, first variable rate N applicator demonstrated to the public 1996 Relationship between total forage N uptake and NDVI was used to apply variable N rates in turf. Indices developed where we could detect differences in N and P, independent of one another. For wheat, numerator wavelengths between 705 and 735, and denominator wavelengths between 505 and 545 proved to be reliable predictors of N and P uptake. In bermudagrass, the index 695/405 proved to be reproducible from one season to the next. Evaluation of management resolution at 3 locations
1997 In 1997, our precision sensing team put together two web sites to communicate TEAM-VRT results. Since that time, over 20,000 visitors have been to our sites. (www.dasnr.okstate.edu/precision_ag) www.dasnr.okstate.edu/nitrogen_use The first attempt to combine sensor readings over sites into a single equation for yield prediction A modification of this index would later become known as INSEY (in-season estimated yield), but was first called F45D.
Cooperative research program with CIMMYT. Kyle Freeman and Paul Hodgen have each spent 4 months in Ciudad Obregon, MX, working with CIMMYT on the applications of sensors for plant breeding and nutrient management. 1998 Cooperative Research Program with Virginia Tech
1999 Applications of indirect measures of electrical conductivity were evaluated in several field experiments. This work aims to identify added input variables to refine the in-season prediction of yield. TEAM-VRT entered into discussions with John Mayfield concerning the potential commercialization of a sensor-based N fertilizer applicator for cereal crops. Increased yields at lower N rates observed at Covington. Using the in-season response index (RINDVI), we were able to project responsiveness to applied N, which changes from location to location based on climatic conditions specific to each parcel of land, and that changes on the same land from year to year.
Discovered that the N fertilizer rate needed to maximize yields varied widely over years and was unpredictable in several long-term experiments. This led to his development of the RESPONSE INDEX. 2000 Predicted potential response to applied N using sensor measurements collected in-season. Approach allowed us to predict the magnitude of response to topdress fertilizer, and in time to adjust topdress N based on a projected ‘responsiveness.’ RI Harvest RI NDVI
2001 N Fertilizer Optimization Algorithm (NFOA): 1. Predict potential grain yield or YP0 (grain yield achievable with no additional N fertilization) from the grain yield-INSEY equation, where; INSEY = NDVI (Feekes 4 to 6)/days from planting to sensing (days with GDD>0) YP0 = 0.74076 + 0.10210 e 577.66(INSEY) 2. Predict the magnitude of response to N fertilization (In-Season-Response-Index, or RINDVI). RINDVI, computed as; NDVI from Feekes 4 to Feekes 6 in non-N-limiting fertilized plots divided by NDVI Feekes 4 to Feekes 6 in the farmer check plots (common fertilization practice employed by the farmer). The non-N limiting (preplant fertilized) strip will be established in the center of each farmer field. 3. Determine the predicted yield that can be attained with added N (YPN) fertilization based both on the in-season response index (RINDVI) and the potential yield achievable with no added N fertilization, computed as follows: YPN = (YP0)/ (1/RINDVI) = YP0 * RINDVI 4. Predict %N in the grain (PNG) based on YPN (includes adjusted yield level) PNG = -0.1918YPN + 2.7836 5. Calculate grain N uptake (predicted %N in the grain multiplied times YPN) GNUP = PNG*(YPN/1000) 6. Calculate forage N uptake from NDVI FNUP = 14.76 + 0.7758 e 5.468NDVI 7. Determine in-season topdress fertilizer N requirement (FNR)= (Predicted Grain N Uptake - Predicted Forage N Uptake)/0.70 FNR = (GNUP – FNUP)/0.70 Work with wheat and triticale plant breeders at CIMMYT, demonstrated that NDVI readings could be used for plant selection Engineering, plant, and, soil scientists at OSU release applicator capable of treating every 4 square feet at 20 mph
Winter Wheat24 locations in Oklahoma1998-2001 Spring Wheat4 locations in Ciudad Obregon, MX2001 Soft White Winter Wheat7 locations in Virginia, 2001
100 lb N/ac 45 bu/ac, 2.5% N in the grain 75 lb N/ac N uptake, lb/ac 50 lb N /ac days with GDD>0? October February June 0 120 240 days INSEY: Rate of N uptake over 120 days, > ½ of the total growing days and should be a good predictor of grain yield
In-SeasonEstimatedYield (INSEY) NDVI at F5 = days from planting to F5, GDD>0 +Good predictor of final grain yield+Requires only one sensor reading+Work over different regions/biotypes Units: N uptake, kg ha-1 day-1 where GDD>0
Fertilize whole field with 40 lbs N/ac preplant • Before exiting the field, apply one strip with 80 (non-N-limiting)
So, what’s in it for the farmer? Ave Loss/ac/yr = $9.77
RINDVI=NDVI-N-non-limiting/NDVI-farmer check RINDVI and RIHARVEST 1998 1999 RI Harvest 2000 2001 RI NDVI • Strong correlation between RINDVI (vegetative stages) and RI HARVEST • Accurately predict the crop’s ability to respond to N • RINDVI may refine whether or not N should be applied, how much, and expected NUE
YPMAX YPN YP0
YPMAX YP0 YPN (RI=2.0) YPN (RI=1.5)
1 3 Predict RI Predict YP0 Predict YPN based on RI Fertilizer N = GNUPYPN –GNUPYP0/0.7 2 2 3 4 1 4