
Regression to Mediocrity
E N D
Presentation Transcript
Regression to Mediocrity Galton and the origins of Regression
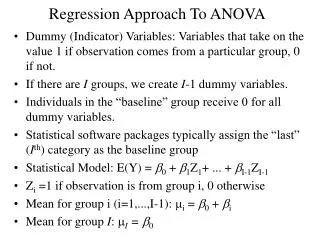
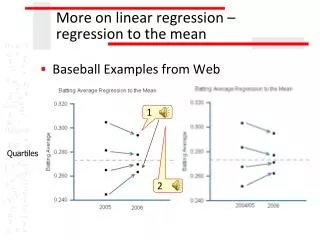
Midterm scores • MT2 = 10 + .9*MT1 + “random noise” • Mean on MT1 was 75. What’s mean on MT2? • Compute “your” score on MT2.
Why? • Regression line is [skill, genetics] + [luck] • The skill persists, but the luck is random and, on average, 0. • Skill + good luck on MT 1 ---> Skill + 0 luck on MT 2, on average
Inheritance • How is talent passed on genetically? Is it? • Talent hard to measure, so instead examine height.
Data • library(UsingR) • data(galton) • attach(galton) • Plot, then predict child’s height from parents. • What are mean heights of each group?
If you’re above average height, what height should you predict your child to be? • Is this height above or below average? • If you’re below average in height, what height should you predict your child to be? • Is this above or below average
Regression Fallacy • So are children getting closer to average? • No. The average height is in fact increasing. Variation about the average is about the same in both generations. • What about the father of a very tall person? Is he also likely to be closer to the mean? • A "statistical artifact"
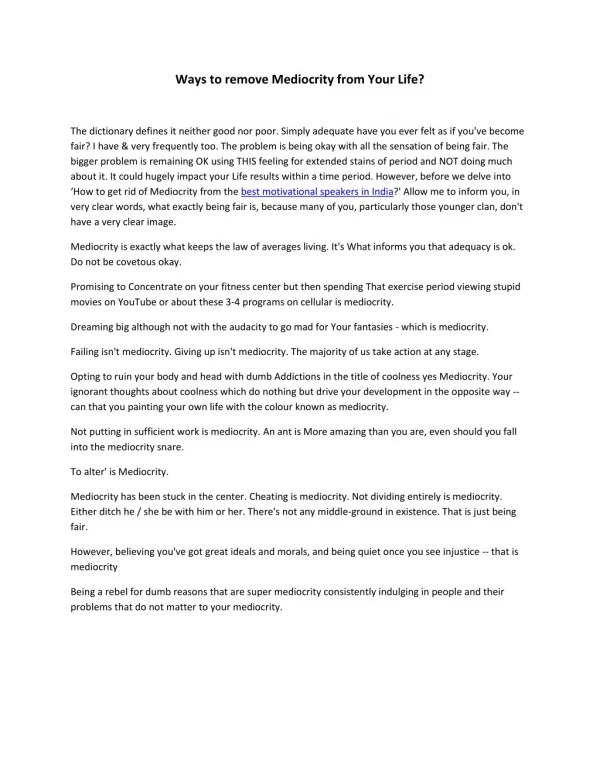
Horace Secrist • “The Triumph of Mediocrity in Business” • Profitably companies become less profitable; • poorly performing companies do better.
From wikipedia • The calculation and interpretation of "improvement scores" on standardized educational tests in Massachusetts probably provides another example of the regression fallacy. In 1999, schools were given improvement goals. For each school, the Department of Education tabulated the difference in the average score achieved by students in 1999 and in 2000. It was quickly noted that most of the worst-performing schools had met their goals, which the Department of Education took as confirmation of the soundness of their policies. However, it was also noted that many of the supposedly best schools in the Commonwealth, such as Brookline High School (with 18 National Merit Scholarship finalists) were declared to have failed. As in many cases involving statistics and public policy, the issue is debated, but "improvement scores" were not announced in subsequent years and the findings appear to be a case of regression to the mean.
Cover Jinx • St. Louis Ram's quarterback Kurt Warner refused to appear, so cat appeared alone. • 2456 people on covers; 913 (37.2%) were "jinxed"