Download
1 / 36
370 likes | 673 Vues
The Mean Regression or Regression to the Mean. Rama C. Nair Professor Epidemiology and Community Medicine. Outline. Why Data Analysis? Qualitative and quantitative data Role of Statistics Quantitative information Variability in data Bias and Random error Population vs sample

E N D
The Mean Regression or Regression to the Mean Rama C. Nair Professor Epidemiology and Community Medicine
Outline • Why Data Analysis? • Qualitative and quantitative data • Role of Statistics • Quantitative information • Variability in data • Bias and Random error • Population vs sample • Regression Analysis • Definition • Types of regressions • Benefits and pitfalls of regression analyses RCN/UO- APHEO
Why data analysis • Research Question • Collection of information • Qualitative and quantitative • Only quantitative information (or information that can be quantified) considered in this presentation • Analyzing the information collected to arrive at a conclusion (decision) about the research question RCN/UO- APHEO
Example • Is childhood obesity an increasing problem in the community? • What might be the major causes for this increasing trend? • Would introduction of supervised physical activities in the school address the issue? • What are the important considerations for a good school program? RCN/UO- APHEO
Role of Statistics in Data Analysis • Variability in data • Measured by Probability Distributions • Understanding the variability • Reasons for variation • Effects of variability on inference • Reliable and valid inference • Random error and Bias RCN/UO- APHEO
Role of statistics in data analysis • Analyzing variability in observed data and arriving at inferences (answers to research questions) that are reliable and valid, in the presence of the bias and ‘random’ errors that are inherent in all data • A tall order • Statisticians start with • Let X1, X2,…, Xn be i.i.d. (independently and identically distributed) with N (µ,σ) to describe the n observations • Epidemiologists put a context and see if the statistical model fits RCN/UO- APHEO
Population vs sample • Truly, statistics only come into play when we are observing only a sample of the whole population • Inference from sample to population is based on the statistical properties of sample statistics based on the probability distribution of the variables • Descriptive analysis involving estimation of characteristics (mean, relative risk, odds ratio, or simply probabilities of events) • Statistical tests of hypotheses about the characteristics (alone or in combination with some estimation) RCN/UO- APHEO
Bias and Random Error • How does one deal with bias and random error in statistical analyses? • Try to minimize bias by choosing appropriate design • Alternately, using mathematical modeling, one may ‘eliminate’ bias in analysis • Random error cannot be avoided, but effect on inference can be minimized by increasing sample size RCN/UO- APHEO
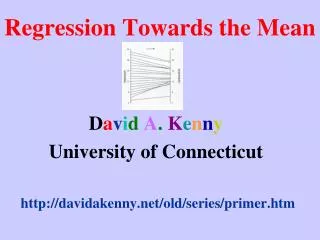
Regression analysis • What is regression RCN/UO- APHEO
Regression - Wikipedia • In statistics, regression analysis examines the relation of a dependent variable (response variable) to specified independent variables (explanatory variables). The mathematical model of their relationship is the regression equation. The dependent variable is modeled as a random variable because of uncertainty as to its value, given only the value of each independent variable. A regression equation contains estimates of one or more hypothesized regression parameters ("constants"). These estimates are constructed using data for the variables, such as from a sample. The estimates measure the relationship between the dependent variable and each of the independent variables. They also allow estimating the value of the dependent variable for a given value of each respective independent variable. • Uses of regression include curve fitting, prediction (including forecasting of time-series data), modeling of causal relationships, and testing scientific hypotheses about relationships between variables. RCN/UO- APHEO
The MEAN Regression • Relating (regressing) the ‘dependent’ variable to the ‘independent’ variable(s) • Simply a way of characterizing a relationship through a mathematical (statistical) model • Simple linear regression • Logistic regression • Cox regression (proportional hazards model for survival analysis) • Time series analysis of recurrent data RCN/UO- APHEO
The mathematical model • All starts with a simple observation • If two variables are related to each other, can one predict the value of one of the variables if the value of the other variable is knows? • Y=f(X), where f is a known mathematical function • The quest is to find the correct form of f RCN/UO- APHEO
The mathematical model • Where does f come from? • Observation • Plotting values of X and Y in a bivariate plot to see if there is any obvious pattern • Theoretical considerations • Area (rectangle) = length x width • A combination of the two RCN/UO- APHEO
The simple linear regression • The simplest form of regression • One dependent variable, Y is related to one independent variable, X • Plot X and Y (scatterplot) • Is there a straight line relationship (Is Y changing proportionally to X)? • Y=α+βX • Two ‘parameters’ determine the equation • Slope of the line and the intercept of the line on the X (independent variable) axis RCN/UO- APHEO
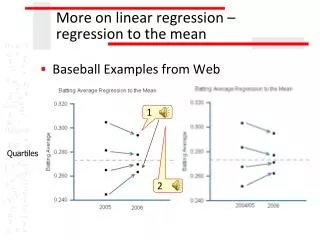
Example of a simple linear regression RCN/UO- APHEO
Simple Linear Regression • Notice that not all data points are on the line, so obviously the equation does not fit all the observations • Not a perfect relationship • The actual relationship is something more complicated • Can we use this relationship as approximation • What are the risks in using this equation to ‘estimate’ the relationship? RCN/UO- APHEO
Simple Linear Regression What is the purpose of identifying this relationship? • Predict values of Y for any given X? • Predict trends in Y based on trends in X? • Predict gain/loss if we introduced a program to change values of Y in the population, by changing values of X? RCN/UO- APHEO
Simple Linear Regression • If Yi is an actual observation in the previous picture, and the equation to the blue line is Y=α+βX, then • Yi=α+βXi+εi The εi would be the deviation (error) of the observed value from the ‘fitted’ value – a measure of uncertainty about the model being a good fit to the data • Clearly many possible lines (other than the blue line) can be drawn and each of them will have different distribution of εi • Which line do we choose as the best fit (one with the least ‘error’)? • Since many data points, we want a cumulative error • Does Mean squared error seem reasonable? RCN/UO- APHEO
Least squares regression • Using minimum mean squared error as the criterion • What is the straight line that best fits the data? • Estimates of α (a) and β (b) • Sample vs Population • a and b are the best estimates of α and β based on the observations and these values are going to be different in different sample, even if the straight line relationship is fixed for the population • Sampling variation of a and b • Measured by standard error of these estimates RCN/UO- APHEO
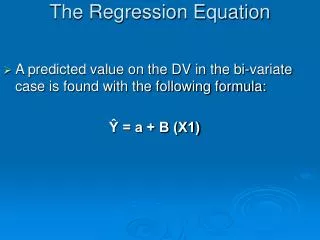
Inference on regression • The regression coefficient • Slope of the regression line signifies the magnitude of change in Y expected with changes in X • For prediction, one needs to know the value of β • Estimated by b • Standard error of b allows one to draw conclusions as to possible true values of β RCN/UO- APHEO
Assumptions for the linear regression • As with many statistical procedures, the first assumption is that the observations are statistically independent of each other • This is essential in constructing the probability distribution of the sample values • It is also assumed that the random errors ε are Normally distributed • This is essential in calculating the actual probability distribution; as long as the distributional form is known, one can do this even if the distribution is not Normal (though difficult); • However, the least squares method of estimating the parameters that we used is optimal when the distribution is Normal RCN/UO- APHEO
Assumptions • A third assumption for the estimated regression equation to be reliable and valid is that the deviation of the observed values from the fitted values remains similar for all values of X (homoscedasticity) • This is essential for the estimates to be unbiased (reliable) RCN/UO- APHEO
Multiple Linear Regression • That was simple. • Now what happens if there are more than one independent variable that might have something to do with the dependent variable? • Can fit slr for each variable – but that is wasteful, and can create confusion, specially if many of the Xs themselves are related to each other • A comprehensive equation, relating all of them in one equation to the dependent variable • Y = Xβ + ε • (matrix notation) • Yi=β1X1i+β2X2i+…+βkXki+εi, for the ith observation RCN/UO- APHEO
Multiple Linear Regression • Essentially same as linear regression • The regression coefficients are now ‘partial’, in that it signifies the amount of linear relationship of one independent variable to the dependent variable, with all the others in the equation • The method of estimation and testing hypotheses are essentially same as simple linear regression • Assumptions are also similar RCN/UO- APHEO
Linear Regression • Goodness of Fit • How does one assess how good the relationship is? • Are the βs significantly different from 0? • Back to the purpose of the regression • Explain the variability in Y as results of variability in X (in other words, Y and X are related) • Amount of variability in Y (variance of Y, function of Mean squared deviation from the mean) • Amount of variability still ‘unexplained’ after the regression (mean squared deviation of the residuals from the fitted line) RCN/UO- APHEO
Linear Regression • Unexplained variation • If perfect fit, the sum of squares of deviation of the residuals is zero • If completely random, (β=0) then this sum of squares is the same as the sum of squares of Y • The difference between the two is a masure of variability ‘explained by’ the relationship, called regression SS • Therefore the ratio of regression SS to the Total SS serves as a criterion for how good the fit is • 0<R2<1, known as the ‘coefficient of determination’ RCN/UO- APHEO
Regression • In the linear regression, notice that we assumed Y has a Normal distribution (by virtue of the linear regression equation and the distribution of random errors) • So the dependent variable has to be a continuous variable • What if it is dichotomous, as with most epidemiologic studies where we are looking at illness or similar entities measured on a dichotomous scale? RCN/UO- APHEO
Logistic Regression • Y is now a dichotomous variable • Clearly we can only talk about proportions (probabilities) of Y being 1 or 0 as something we can predict • Transforming Y to the logistic function, would help this (mathematical derivation of why this is feasible or desirable is available in many texts: e.g. Hosmer and Lemeshow – Applied Logistic Regression) RCN/UO- APHEO
Derivation of the logistic model • Let (x)=(e0+ 1X)/(1+ e 0+ 1X) • The logit transformation • g(x)=ln [(x)/(1- (x))] • g(x) = 0+ 1X • linear regression for g(x) • Original outcome y • Distribution of y not Normal • y= (x)+ε • ε=1- (x) with prob. (x) when y=1 • ε=-(x) with prob 1- (x) when y=0 RCN/UO- APHEO
Logistic regression • Analysis steps • n independent pairs (xi,yi) • estimate regression coefficients and goodness of fit of the model • linear regression - least squares • maximum likelihood if y normally distributed • logistic regression -maximum likelihood RCN/UO- APHEO
Logistic regression • Maximum likelihood method • Given a parametric model, the maximum likelihood estimates for a set of parameters maximizes the probability of obtaining the observed data • The likelihood function = joint probability of observations under the given probability distribution RCN/UO- APHEO
Logistic Regression • P(Y=1|x) = (x) • P(Y=0|x) = 1-(x) • Prob. For observation (xi,yi) • (xi) if yi=1 • 1-(xi) if yi=0 • (xi)yi(1-(xi))1-yi in general • For n observations, the joint probability (because independent) • Prod [(xi)yi(1-(xi))1-yi ] • This is the likelihood function l RCN/UO- APHEO
Logistic regression • Maximizing the likelihood function is achieved by maximizing its log • Unlike linear regression, one cannot get a linear equation to calculate the regression coefficients • Need to obtain estimates by iteration because the equation is nonlinear RCN/UO- APHEO
Logistic regression • Inferences on the regression coefficient follows the same rules as linear regression • Estimates and standard errors of β are calculated and approximate Normal distributions are used (Wald test) • Interpretation of β • Related to odds ratio as e -β • Calculate odds ratio and its standard error • Goodness of fit • Again not as simple as simple linear regression • Many methods available RCN/UO- APHEO
Regression • In summary • Regression is a simple way of relating variables by the use of mathematical functions, allowing one to examine the variability in one variable as a function of variability in the other • Relationship could be one-one or one-many • Allows for adjustment of confounding, (assuming general linear model) • Some allowance for testing effect modification • Need to be careful of the assumptions regarding data collection, data format, patterns of variability, study design RCN/UO- APHEO
Regression • In summary • Any model can be used to fit the data • Interpretation depends primarily on the theoretical foundation for the model • Parameters of the model may have identifiable characteristics (for example the odds ratio in logistic regression) and meaningful definitions when the theoretical foundation is solid • While confounding can bd adjusted and effect modification detected, this is very much model dependent RCN/UO- APHEO