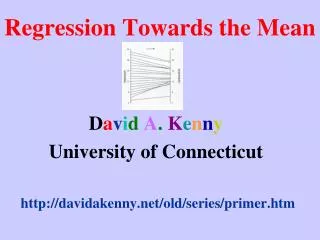
Regression to the Mean
340 likes | 682 Vues
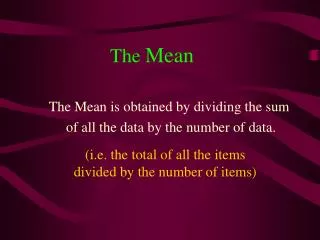
Regression to the Mean. The Simple Explanation. When you select a group from the extreme end of a distribution. The Simple Explanation. When you select a group from the extreme end of a distribution. Selected group’s mean. Overall mean. The Simple Explanation.

Regression to the Mean
E N D
Presentation Transcript
The Simple Explanation... When you select a group from the extreme end of a distribution...
The Simple Explanation... When you select a group from the extreme end of a distribution... Selected group’s mean Overall mean
The Simple Explanation... When you select a group from the extreme end of a distribution... Selected group’s mean Overall mean the group will do better on a subsequent measure.
The Simple Explanation... When you select a group from the extreme end of a distribution... Selected group’s mean Overall mean the group will do better on a subsequent measure. Where it would have been with no regression
The Simple Explanation... When you select a group from the extreme end of a distribution... Selected group’s mean Overall mean the group will do better on a subsequent measure Where its mean is
The Simple Explanation... When you select a group from the extreme end of a distribution... Selected group’s mean Overall mean the group will do better on a subsequent measure. The group mean on the first measure appears to “regress toward the mean” of the second measure. Overall mean
The Simple Explanation... When you select a group from the extreme end of a distribution... Selected group’s mean Overall mean the group will do better on a subsequent measure. The group mean on the first measure appears to “regress toward the mean” of the second measure. Overall mean Regression to the mean
Example I: Pretest If the first measure is a pretest and you select the low scorers...
Example I: Pretest If the first measure is a pretest and you select the low scorers... ...and the second measure is a posttest Posttest
Example I: Pretest if the first measure is a pretest and you select the low scorers... ...and the second measure is a posttest, regression to the mean will make it appear as though the group gained from pre to post. Posttest Pseudo-effect
Example II: Pretest If the first measure is a pretest and you select the high scorers...
Example II: Pretest if the first measure is a pretest and you select the high scorers... ...and the second measure is a posttest, Posttest
Example I: Pretest If the first measure is a pretest and you select the high scorers... ...and the second measure is a posttest, regression to the mean will make it appear as though the group lost from pre to post. Posttest Pseudo-effect
Some Facts • This is purely a statistical phenomenon. • This is a group phenomenon. • Some individuals will move opposite to this group trend.
Why Does It Happen? • For low scorers, you have taken the lowest x%. What are the chances they will be the lowest x% on the second measure? • For high scorers, you have taken the highest x%. What are the chances they will be the highest x% on the second measure?
Why Does It Happen? • Regression artifacts occur whenever you sample asymmetrically from a distribution. • Regression artifacts occur with any two variables (not just pre and posttest) and even backwards in time!
What Does It Depend On? The absolute amount of regression to the mean depends on two factors: • The degree of asymmetry (i.e., how far from the overall mean of the first measure the selected group's mean is) • The correlation between the two measures
A Simple Formula The percent of regression to the mean is
A Simple Formula The percent of regression to the mean is: Prm = 100(1 - r)
A Simple Formula The percent of regression to the mean is Prm = 100(1 - r) Where r is the correlation between the two measures.
A Simple Formula The percent of regression to the mean is: Prm = 100(1 - r) Where r is the correlation between the two measures. The formula tells the %, but the actual amount depends on how far the group mean is from the overall mean on the selection variable.
For Example: Prm = 100(1 - r) • If r = 1, there is no (i.e., 0%) regression to the mean. • If r = 0, there is 100% regression to the mean. • If r = .2, there is 80% regression to the mean. • If r = .5, there is 50% regression to the mean.
Example Assume a standardized test with a mean of 50. Pretest 50
Example Assume a standardized test with a mean of 50 Pretest You give your program to the lowest scorers and their mean is 30. 30 50
Example Assume a standardized test with a mean of 50. Pretest You give your program to the lowest scorers and their mean is 30. Assume that the correlation of pre-post is .5. 30 50 Posttest
Example Assume a standardized test with a mean of 50. Pretest You give your program to the lowest scorers and their mean is 30. Assume that the correlation of pre-post is .5. 30 50 The formula is… Posttest
Example Assume a standardized test with a mean of 50. Pretest You give your program to the lowest scorers and their mean is 30. Assume that the correlation of pre-post is .5. 30 50 The formula is Prm = 100(1 - r) = 100(1-.5) = 50% Posttest 50%
Example Assume a standardized test with a mean of 50. Pretest You give your program to the lowest scorers and their mean is 30. Assume that the correlation of pre-post is .5. 30 50 The formula is Prm = 100(1 - r) = 100(1-.5) = 50% Therefore the mean will regress up 50% (from 30 to 50), leaving a final mean of 40 and a 10 point pseudo-gain. 40 Posttest Pseudo-effect