Download
1 / 12
120 likes | 203 Vues
Explore Globe Union's multifaceted investment plans including kitchen cabinet and ceramic factory expansions to drive profitability in diverse markets.

E N D
800 697 600 396 316 304 400 239 154 109 200 0 2001 2002 2003 2004 2005 2006 2007 Sales- GU Group Unit:USD million (NTD Billion) (NT 22.5) Note: CAGR (2001 ~ 2007) =30.33 %
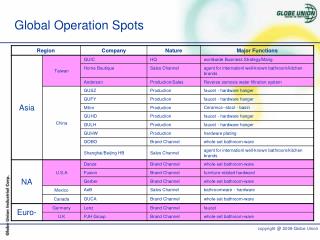
GU sales breakdown 100%= US 697 million (2007) Europe 47% North America 48% China 1% Others 4%
Historical Profits –GUIC (Taiwan) Unit: NTD million ? 1000 800 ◆ 654 (9months) 600 ◆ 500 ◆ 400 435 (9months) ◆ 200 218 2005 2006 2007
Future Investment(1):Kitchen Cabinet Manufacturing Facotry--JV to be formed between GU and German Co Expected Invesmtment: NTD 100milion
Future Investment(2): --Shanghai HB Expansion Expected Investment: NTD 130million Beijing Shanghai
Future Investment (3):--Qing Dao Faucet Manufacturing Factory Expected Investment: NTD 260million
Future Investment (4):--Milim Ceramics Factory Expansion Expected Investment: NTD 230million
Driving Factors to Year 2008 Profitability 1. Inclusive of PJH Q1 earnings 2. PJH products to be supplied from China 3. CB raised to return bank loan 、reduce interest expense 4. Growths derived from HB、GOBO in China market 5. Business from Kitchen Cabinet Factory 6. Growth in NA and European markets 7. Reduce in Raw Material Cost Unit: NTD million ? 1000 800 600 ◆ 500 400 200 ◆ 218 2008 2005 2006 2007