
Landscape Nutrient Leaching Study: Impacts, Analysis & Recommendations
Study on nutrient leaching from amenity landscapes, focusing on N, P, and DOC, with findings on treatment effects and plant varieties. Analysis includes irrigation water composition and chemical testing methods.

Landscape Nutrient Leaching Study: Impacts, Analysis & Recommendations
E N D
Presentation Transcript
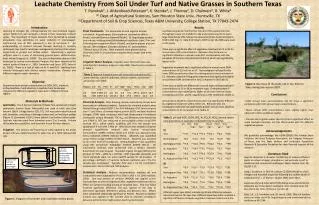
1.27 cm diameter perforated pipe to evacuate leachate was embedded in gravel. Cables from moisture sensors to data logger Introduction Leaching of nitrogen (N), orthophosphate (P), and dissolved organic carbon (DOC) from soil represents a break in their respective nutrient cycles. The movement of these elements from terrestrial to aquatic ecosystems may contribute to water pollution if mismanaged. Furthermore, loss of DOC represents a loss of terrestrial C. An understanding of nutrient removal through leaching in amenity landscapes may lead to landscape management practices that reduce impairment to ground and surface waters. Maintaining a vigorous turfgrass cover is a way of minimizing ground water contamination from nitrate (Jiang et al., 2000). The use of alternative plants in the landscape to reduce environmental impacts has been researched by several authors (Hipp et al., 1993; Sacamano and Jones 1975; Saha et al., 2005). There is a lack of data on N, P, and DOC leaching from amenity landscapes with diverse species composition, climates and different irrigation water chemistry. Results Leachate samples for the first four months of the experiment (Jan through Apr) were not included in the analysis because there was a large disturbance effect shown by enhanced nitrate-N concentrations (100 to 200 mg L-1). Data from May 5, 2007 to Apr 28, 2008 were used in this study. There was no significant effect of vegetative treatment at CS or SA for annual mean DOC concentrations. Between sites there was no significant difference in annual mean DOC concentration with the exception of the tree only treatment (Table 2) which was significantly higher at SA. Vegetative treatment had a significant effect on annual mean DON concentration at CS, but not at SA. Bermudagrass had significantly lower DON concentration than the nativegrass plus tree treatment at CS. Between sites the St Augustine treatment had significantly higher annual mean DON concentration at CS compared to SA (Table 2). There was no significant difference in annual mean orthophosphate-P concentrations at CS or SA by treatment type. Orthophosphate-P concentrations were significantly higher at SA under the tree alone, nativegrass plus tree, and St. Augustine plus tree treatments (Table 2). Annual mean alkalinity concentrations were not significantly different by vegetative treatment within either site. Between sites the nativegrass treatment had significantly greater annual mean alkalinity concentration at CS compared to SA (Table 2) Plant Treatments. The treatments at each regional location included St. Augustinegrass [Stenotaphrumsecundatum(Walt.) Kutze.], red oak [QuercusshumardiiBuckl.], St. Augustinegrass plus one red oak, native grasses ([Muhlenbergia capillaries (Lam.) Trin. and Schizachyriumscoparium(Michx.) Nash]), and native grasses plus one red oak. Bermudagrass [Cynodondactylonx C. transvaalensis ‘Tifway’] was at CS only. Plant materials were planted during December 2006 in a randomized complete block design with three blocks. Irrigation Water Analysis.Irrigation water from both sites was submitted for laboratory analysis in July 2008. Results are summarized in Table 1. Table 1. Regional irrigation water pH, electrical conductivity (EC), plant nutrients, calcium carbonate, sodium content, and sodium adsorption ratio (SAR) Region pH EC PO43- K+ Ca2+ Mg2+ SO42- HCO3- Na+ SAR S m-1 - - - - - - - - - - - - - - - mg L-1 - - - - - - - - - - - - - - - CS 9.09 0.089 0.1 2.0 2.0 0.5 0.6 393.4 232.0 53.7 SA 7.85 0.057 0.0 1.9 24.1 16.3 27.0 190.4 12.3 0.7 Chemical Analysis. After thawing, sample conductivity and pH were measured on unfiltered samples. Samples for chemical analysis were filtered through ashed (500º C for 4 h) Whatman GF/F (nominal pore size 0.7 µm) filters. Dissolved organic carbon (DOC) and total dissolved nitrogen (TDN) were measured with high temperature Pt-catalyzed combustion using a Shimadzu TOC-VCSH and Shimadzu total measuring unit (TNM-1). DOC was measured as non-purgable carbon using UEPA method 415.1 which entails acidifying (2N HCl) the sample and sparging for 4 min with C-free air. Ammonium was analyzed using the phenate hypochlorite method with sodium nitroprusside enhancement (USEPA method 350.1) and nitrate was analyzed using Cd-Cu reduction (USEPA method 353.3). Alkalinity was quantified using methyl orange (USEPA method 310.2). Alkalinity was assumed to be in the form of bicarbonate. Orthophosphate-P was quantified using the ammonium molybdate method (USEPA 365.1). All colorimetric methods were performed with a Westco Scientific Smartchem Discrete Analyzer. Dissolved organic nitrogen (DON) is the product of TDN – (NH3-N + NO3-N). NIST traceable standards and check standards were run every twelfth sample for all analyses. If percentage coefficient of variance between replicates was >5%, the sample was re-analyzed. Typically, %CV was < 1% for colorimetric analysis and < 5% for DOC and TDN analyses. Statistical Analysis. Nutrient concentrations, leachate pH and conductivity were subjected to Proc GLM in SAS v. 9.1 (SAS Institute, 2003). One way analysis of variance (ANOVA) was applied to the leachate data to test the hypothesis that vegetative treatment had no effect on nutrient leaching among or between sites. Post hoc Tukey honestly significant difference test was applied to the data to determine significant differences among and between sites. Effects were considered statistically significant at P≤0.05. Pearson correlation analysis was applied to the nutrient data to examine correlations between nutrients that might explain leaching mechanisms. Leachate Chemistry From Soil Under Turf and Native Grasses in Southern TexasT. Pannkuk1, J. Aitkenhead-Peterson2, K. Steinke2, J. Thomas2, D. Chalmers2, R. White2(1) Dept of Agricultural Sciences, Sam Houston State Univ., Huntsville, TX(2) Department of Soil & Crop Sciences, Texas A&M University, College Station, TX 77843-2474 Figure 3. Overview of the study site in San Antonio Texas during late-season 2007. • Conclusions • DON annual mean concentrations did not show a significant correlation with DOC annual mean concentrations. • Mean annual DON concentrations were slightly higher than observed in other published studies. • Climate and irrigation water chemistry had a significant effect on some leachate chemistry, but this effect varied with the different vegetative species. Materials & Methods Lysimeters.The A horizon material of Rader fine sandy loam (mixed, semiactive, thermic Aquic Paleustalfs) was used at both sites [San Antonio (SA) & College Station (CS), TX]. Soil was systematically placed into lysimeters containing a drainage system and soil moisture probes (Figure 1). Lysimeters (1136 L) were placed 5 cm below surface grade. Leachate was evacuated from lysimeters every 2 to 3 weeks. Volume of leachate was quantified, and a portion frozen for later analysis. Irrigation. The amount and frequency of water applied to the plants at each site was determined by ETo water loss at a 100% replacement rate. Table 2. pH and DOC, DON, NO3-N, PO4-P, HCO3 annual mean concentrations in leachate collected from CS and SA. pH DOC DON NO3-N PO4-P HCO3 mg L-1 mg L-1 mg L-1μg L-1 mg L-1 CS Tree Ba7.8 Ba11.0 Aab2.0 Bbc16.7 Ba4.5 Aa101 Bermudagrass a8.0 a16.0 a0.9 c0.2 a10.9 a132 Nativegrass+Tree Ba7.8 Aa14.5 Ab9.0 Aa44.3 Ba3.3 Aa99 St. Augustine Ba8.3 Aa14.5 Aab3.5 Abc16.0 Aa3.7 Aa181 Nativegrass Aa8.2 Aa14.7 Aab6.0 Aab27.9 Aa4.1 Aa189 St. Augustine+Tree Ba8.0 Aa14.2 Aab4.7 Aabc21.4 Ba2.5 Aa157 SA Tree Aa8.7 Aa16.7 Aa3.9 Aa27.4 Aa12.7 Aa155 Nativegrass+Tree Aa8.6 Aa18.7 Aa4.1 Aa13.8 Aa28.5 Aa168 St. Augustine Aa8.8 Aa11.6 Ba1.2 Aa8.0 Aa13.4 Aa180 Nativegrass Aa8.5 Aa12.5 Aa3.0 Aa16.6 Ba11.6 Ba106 St. Augustine+Tree Aa8.6 Aa14.1 Aa2.0 Ba9.2 Aa17.8 Aa179 Different upper case letters indicate significant difference between same treatment at the two sites. Different lowercase letters indicate a significant difference between vegetative treatment within each site. Objective Determine mean annual concentrations of DON, DOC, nitrate-N, orthophosphate-P and alkalinity in leachate from landscapes comprised of different vegetation types and in different climate regions. Acknowledgements We gratefully acknowledge the USDA-CSREES Rio Grande Basin Initiative, the Texas Turfgrass Association, the Turfgrass Producers of Texas, and the Texas Nursery and Landscape Association Research & Education Foudation for their financial support of this research. Literature Cited Hipp BS, Alexander S, Knowles T (1993) Use of resource efficient plants to reduce nitrogen, phosphorus, and pesticide runoff in residential and commercial landscapes. Water Science Tech. 28 (3);205-213. Jiang Z, Bushoven JT, Ford HJ, Sawyer CD (2000) Mobility of soil nitrogen and microbial responses following the sudden death of established turf. J. of Environ. Quality 29(5):1625-1631. Sacamano CM and Jones WD (1975) Native trees and shrubs for landscape use in the desert southwest. Univ. Arizona Coop. Ext. Serv. Bull A-82. Univ. of Arizona, Tucson, AZ. Saha, S.K., L.E. Trenholm, and J.B. Unruh. 2005. Effect of fertilizer source on water use of St. Augustinegrass and ornamental plants. HortScience 40:2164. Figure 1. Diagram of lysimeter and installation below grade.


