Graphing Logarithmic Functions: Examples and Solutions
Learn how to graph logarithmic functions with detailed examples and solutions. Plot points, draw curves, determine domain and range. Practice and master essential graphing skills.

Graphing Logarithmic Functions: Examples and Solutions
E N D
Presentation Transcript
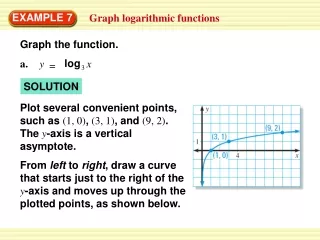
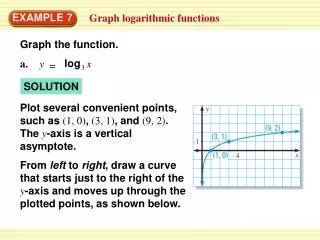
log a. y x = 3 EXAMPLE 7 Graph logarithmic functions Graph the function. SOLUTION Plot several convenient points, such as (1, 0), (3, 1), and (9, 2). The y-axis is a vertical asymptote. From left to right, draw a curve that starts just to the right of the y-axis and moves up through the plotted points, as shown below.
log b. y x = 1/2 EXAMPLE 7 Graph logarithmic functions Graph the function. SOLUTION Plot several convenient points, such as (1, 0), (2, –1), (4, –2), and (8, –3). The y-axis is a vertical asymptote. From left to right, draw a curve that starts just to the right of the y-axis and moves down through the plotted points, as shown below.
Graph . State the domain and range. y (x + 3) + 1 = log log 2 2 Sketch the graph of the parent function y = x, which passes through (1, 0), (2, 1), and (4, 2). EXAMPLE 8 Translate a logarithmic graph SOLUTION STEP 1 STEP 2 Translate the parent graph left 3 units and up 1 unit. The translated graph passes through (–2, 1), (–1, 2), and (1, 3). The graph’s asymptote is x = –3. The domain is x > –3, and the range is all real numbers.
log 16. y x = 5 for Examples 7 and 8 GUIDED PRACTICE Graph the function. State the domain and range. SOLUTION The domain is x > 0, and the range is all real numbers.
log 17. y (x – 3) = 1/3 for Examples 7 and 8 GUIDED PRACTICE Graph the function. State the domain and range. SOLUTION domain: x > 3, range: all real numbers
log 18. y (x + 1) – 2 = 4 for Examples 7 and 8 GUIDED PRACTICE Graph the function. State the domain and range. SOLUTION domain: x > –1, range: all real numbers