Download
1 / 37
370 likes | 481 Vues
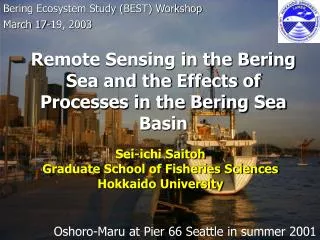
Evaluation of ocean circulation models for the Bering Sea and Aleutian Islands Region. Albert J. Hermann 1 and David L. Musgrave 2

E N D
Evaluation of ocean circulation models for the Bering Sea and Aleutian Islands Region Albert J. Hermann1 and David L. Musgrave2 National Oceanic & Atmospheric Administration, Pacific Marine Environmental Laboratory, 7600 Sand Point Way NE, Seattle, WA 98115 USA, (206) 526-6495, Albert.J.Hermann@noaa.gov. 2 School of Fisheries and Ocean Sciences, Insitute of Marine Science P.O. Box 757220, Fairbanks AK 99775-7220 USA, (907) 474-7837, musgrave@ims.uaf.edu2
This workshop explored the present and future state of ocean circulation modeling and biological modeling of the Bering Sea and Aleutian Island (BSAI) and the North Pacific Major topics: • 1) the present state of knowledge concerning the BSAI • 2) the various types of circulation models which could be applied to the BSAI, with some assessment of their strengths and weaknesses • 3) existing physical and biological models • 4) adequacy of present forcing and bathymetry datasets • 5) current status and future prospects for data assimilation • 6) modeling needs of managers for this region • 7) a timetable over which we might expect the development of improved models
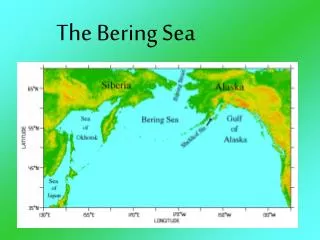
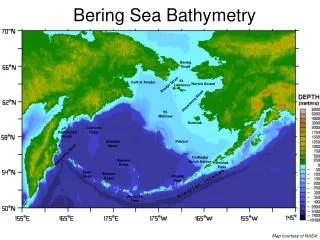
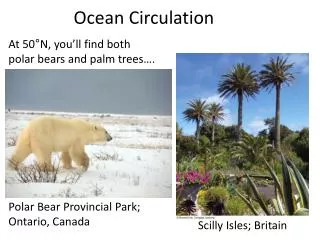
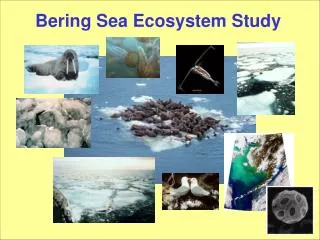
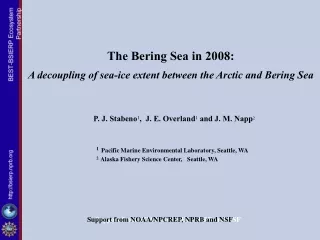
1. Present state of knowledge of the BSAI region • Highly productive • A big, broad shelf • Passes: • wide, narrow, shallow, deep • Canyons • Cross-shelf flux • Powerful tides • A deep basin • Ice
A few highlights…. • Flows through passes – spatially variable, strongly mixed, very important to biology • Ice-edge blooms with possible “Oscillating Control” • Distinct shelf regimes via tidal mixing • Getting warmer, less ice! • PDO was significant, but now other modes more important
2. Classes of Ocean Circulation Models • Pure tidal models • Quasi-gestrophic models (simpler physics) • Primitive equation models (hydrostatic but otherwise include all physics) • Terrain-following coordinates • Z-coordinate • Layered coordinate • Unstructured grid
3.1 Atmospheric models • National Center for Environmental Prediction (NCEP) hindcasts • Assimilated atmospheric data • Easy to get! • Biases include shortwave radiation (not enough stratus clouds) • ECMWF hindcasts • Better for Europe, not necessarily better for Bering • Commercial product • Community Climate Systems Program • Offers global hindcasts and climate forecasts • Better shortwave radiation (b/c assimilates cloud data/climatology) • Regional models • ETA – downscales NCEP nowcasts • NARR – downscales NCEP hindcasts • MM5 – general tool for downscaling global winds
3.2. Ice models • Hibler model and its decendents: • Thermodynamics: • Melt/freeze, snow layers • Dynamics • Viscous-plastic solid • Vary in number of ice/snow layers
3.3 Circulation models • Maslowski group • N Hemisphere model based on MOM/POP • Chao group • N Pacific model based on ROMS • Wang group • Bering Sea model based on POM • Curchitser/Hermann group • Northeast Pacific model based on ROMS
3.4. NPZ Models • 3.4.1. 1D models • NEMURO – NPZD and fish • Saury and herring • Merico (2001) – NPZD • phytoplankton succession • 3.4.2. 3D models • Run both “online” and “offline” • Examples: • Wang/Diehl NPZ model of Bering • Hinckley et al NPZ models of CGOA • Powell/Hermann NPZ for Northeast Pacific
3.5 Individual-based Models • Float-tracking plus behavior • Very useful for individual fish species • Can run online or offline • Examples (from CGOA) • Hinckley et al pollock model • Rand salmon model
3.6 Aggregated models • Consider entire food web • ECOPATH – look at steady state • ECOSIM – add time • ECOSPACE – add space and time • Can benefit from coupling with NPZD
3.7 Fisheries models • MSVPA • Other stock assesment models
4. Adequacy of models, forcing and bathymetry • IDEALLY we would like • Uniformly fine scale resolution or adaptive space/time resolution • Numerically accurate/convergent • Handle tides, subtidal flows, mixing all together • Perfectly accurate bathymetry • Perfectly accurate forcing; hincasts and forecasts
4.1 Numerics and resolution • Terrain-following coordinates • Tend to overemphasize bathymetry • Need smoothed bathymetry • Great for surface and bottom boundary layers • Z-coordinate • Less accurate/convergent numerics • Consistent vertical spacing near the surface • Distort bottom topography into stair steps • Layered coordinate • Good for the deep ocean • bad for the shallow ocean (can’t do tidal mixing) • Unstructured grid • Potentially powerful • Hard to implement • Relatively untested in the Bering Sea • Danger of predetermining answer with choice of grid
Crucial elements to get right… • Inflow/outflow through the Aleutian passes • sets conditions in the Southeast BS • Outflow through the Bering Strait • Tidal mixing on the shelf • Ice!
4.2 Ice • Hibler-based models are probably sufficient for the Bering Sea (no multiyear ice) • Major uncertainties arise from shortwave radiation forcing; need to improve
4.3 Atmospheric forcing • NCEP probably OK for winds (except for Aleutians) • NCEP shortwave is badly biased • CCSM is promising • Need better bulk flux algorithms (e.g. to relate wind speed to wind stress) • Extended range mesoscale forecasts are impossible • Long range forecasts/scenarios are useful • Downscaling is needed!
4.4 Freshwater discharge • Important in a few areas • Data is essentially nonexistent!
4.5 Tides • Existing models can handle tidal and subtidal dynamics simultaneously • This is crucial for the Bering Sea, as the two interact • Tidal phasing may be biologically important, so want to get it right.
4.6 Bathymetry • OK on the shelf • Need more data in the canyons • Need much more data in the passes • USGS eventually digitizing the Bering Sea charts
4.7 NPZ models • Need to get: • Pelagic/benthic gradients, north-south and cross-shelf • Green Belt at the shelf break • Important prey species for fish • Jellyfish? • IRON and other nutrients
4.8 IBM models • Need better data on fish movement and behaviour • Need better data on space/time distribution • Groundfish surveys have been very useful for modelers.
4.9 Aggregated models • Could benefit from NPZ results • Aggregate NPZ by space, water mass, or biological regime?
4.10 Fisheries models • As with aggregated models, could make more spatially explicit
4.11 Model coupling • IDEAL integrate model might include: • IBMs of Multiple species and life stages • NPZ with multiple size classes • Feedback between IMB and NPZ! • Long time scale simulations • Web-accessible output and graphics
5. Status, Needs and Prospects for Data Assimilation • T,S, nutrients in passes would be powerful constraint • Skill assesment is difficult to do well • Existing physical assimilation capabilities • 3D variational assimilation (ROMS, Chao et al.) • “Weak constraint” blend of data and model • Useful for nowcasts, not as good for dynamical analysis • Inexpensive to run • 4D variational assimilation (ROMS, Moore et al.) • “Strong constraint” adjustment of IC and BC for hindcasts • Can be used for sensitivity analysis, indices! • Can be expensive to run • Possibilities for biological model optimization • 4D variational assimilation (in ROMS) • Genetic algorithms
Data sources • SMMR sattelite for ice cover • TOPEX/POSEIDON/AVISO altimetry • No information on the shelf • Long term moorings • Nice long time series should be continued • Long spatial correlation scales make these representative of broad areas on the shelf • XBT data very sparse prior to the 70s • Hydro/mooring data sparse for the Western Bering Sea • BASIS program in the Eastern Bering • Global circulation models for ICs and BCs
6. Needs of managers • Mandates from • National Environment Protection Act • Marine Mammal Protection Act • Endangered Species Act • Stellar sea lion • Sea otters • Fur seals • Right whales • Fin whales • Predictions of 5-10 years are of special interest • Issues include • Bycatch • Indirect effects of fishing • Phys-bio interactions • Hindcasts of circulation and biology can help establish likely response to future change • Need better indices!
7. Estimated timetable of new model products and projects • See the report!
Summary I • The ideal circulation model would adequately and simultaneously resolve all the relevant scales of motion and phenomena in the BSAI, e.g. • flows through the Aleutian Passes • seasonal ice • tidal mixing on the shelves. • None of the present modeling approaches can rapidly and simultaneously capture all of these features for extended time periods on today’s computers • continuing advances in computer technology are expected to expand the limits of feasible simulations, at least doubling the possible spatial resolution for such runs before 2010. • Both nested approaches with structured grids, and variable resolution approaches with unstructured grids, appear promising ways forward.
Summary II • Present ice model algorithms appear adequate for the Bering Sea. • The accuracy of circulation hindcasts for the BSAI are limited by the paucity of data, especially as regards the passes. • Long-term moorings and systematic hydrographic surveys, in conjunction with altimeter data, will help rectify this deficiency • Effective mathematical approaches are now available in community model codes for effective assimilation of such data into hindcasts and nowcasts. Computer resources are still a limiting factor in the application of some of these codes. • The atmospheric forcing datasets also have outstanding issues (e.g. biased shortwave radiation estimates), which limit the hindcast skill of BSAI simulations, and of ice in particular.
Summary III • The ideal scientific/management biological model might include • multiple species and multiple life stage components • specific species treated using spatially explicit IBMs • coupled to multi-compartment NPZ and circulation models • Proper feedback among different components especially challenging • Intermediate step: focus on coupling spatially explicit NPZ with spatially aggregated food web models. • For all models, longer time scales are needed to aid in ecosystem-based management. • Data gaps are even larger for the biology than for the physics of the BSAI • sustained surveys (e.g. the NMFS groundfish surveys) have yielded much useful data for the quantification of food webs.
Summary IV • More collaborative development of both physical and biological models is recommended, as they will require substantial human resources. • Human time to examine and interpret the output can be just as limiting as computer hardware • One way to ease the development and interpretation of such multi-investigator models is to provide easy access to model output through web-based software.
FIN! • http://halibut.ims.uaf.edu/SALMON/BSIAModelWorkshop
Features of the Bering Sea • A big, broad shelf • Passes: • wide, narrow, shallow, deep • Canyons • Cross-shelf flux • Powerful tides • A deep basin • Ice • High production • Lots of fish! • Climate change
Foci of the workshop • review existing modeling efforts in the BSAI • assess strengths and weakness of the various types of ocean circulation models in accurately representing circulation, mixing and exchange due to • forcing mechanisms (winds, tides, ice formation, river runoff) • topographic features (coastline, shelf break, Aleutian Island passes) • evaluate various monitoring and process studies that would improve the accuracy of the models • describe pathway for using these models to develop products that would be useful for resource managers and users.