What is an exponential function?
Tuesday April 15, 2014. 7.1 Exponential Growth Functions. Objective : To solve and graph polynomial and radical functions. EQ : Can you graph an exponential function?. What is an exponential function?

What is an exponential function?
E N D
Presentation Transcript
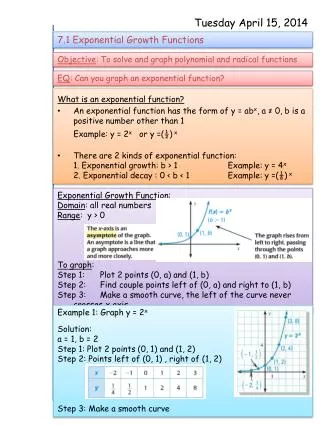
Tuesday April 15, 2014 7.1 Exponential Growth Functions Objective: To solve and graph polynomial and radical functions EQ: Can you graph an exponential function? • What is an exponential function? • An exponential function has the form of y = abx, a ≠ 0, b is a positive number other than 1 • Example: y = 2x or y =(½) x • There are 2 kinds of exponential function: • 1. Exponential growth: b > 1 Example: y = 4x • 2. Exponential decay : 0 < b < 1 Example: y =(⅛) x Exponential Growth Function: Domain: all real numbers Range: y > 0 To graph: Step 1: Plot 2 points (0, a) and (1, b) Step 2: Find couple points left of (0, a) and right to (1, b) Step 3: Make a smooth curve, the left of the curve never crosses x axis Example 1: Graph y = 2x Solution: a = 1, b = 2 Step 1: Plot 2 points (0, 1) and (1, 2) Step 2: Points left of (0, 1) , right of (1, 2) Step 3: Make a smooth curve
Tuesday April 15, 2014 7.1 Exponential Growth Functions Example: Solution: Practice: Solution:
Tuesday April 15, 2014 7.1 Exponential Growth Functions • Exponential Growth Models: y = a (1+r) t • a = initial amount, r = % (in decimal form), t = time • Example: In 1996, there were 2573 computer viruses security incidents. During the next 7 years, the number of incidents increased by 92% per year. • Write the exponential growth model giving the number n of incidents t years after 1996 • Graph the model • Use the graph to estimate the year when there were about 125,000 computer security incidents • Solution:
Tuesday April 15, 2014 7.1 Exponential Growth Functions • Translations • To graph a function of the form y = abx-h +k: • sketch y = abx • then translate: • h units horizontally and • k units vertically • Example: y = 4. 2x-1 – 3 • Graph y= 4. 2x • a = 4, b=2 • h = 1, k = -3 • Example : Graph the function. State the domain and range • y = 4x 2. y = ½ 3x 3. y = 3x-1 – 3 • Exponential Growth Models: y = a (1+r) t • a = initial amount, r = % (in decimal form), t = time • Example: In 1996, there were 2573 computer viruses security incidents. During the next 7 years, the number of incidents increased by 92% per year. • Write the exponential growth model giving the number n of incidents t years after 1996 • Graph the model • Use the graph to estimate the year when there were about 125,000 computer security incidents • Solution:
Wednesday April 23, 2014 7.2 Exponential Decay Functions Objective: To solve and graph polynomial and radical functions EQ: Can you graph an exponential function? Exponential Decay Function has the form of f (x) = of y = abx, where 0 < b < 1 Domain: all real numbers Range: y > 0 To graph: Step 1: Plot 2 points (0, a) and (1, b) Step 2: Find couple points left of (0, a) and right to (1, b) Step 3: Make a smooth curve, the left of the curve never crosses x axis Example 1: Graph y = (1/2)x Solution: a = 1, b = 1/2 Step 1: Plot 2 points (0, 1) and (1, 1/2) Step 2: Points left of (0, 1) , right of (1, 1/2) Step 3: Make a smooth curve
Wednesday April 23, 2014 7.2 Exponential Decay Functions Example: Translations
Tuesday April 15, 2014 7.2 Exponential Growth Functions • Exponential Decay Models: y = a (1 - r) t • a = initial amount, r = % (in decimal form), t = time • Example: A snowmobile costs $4200. The value of the snowmobile decreases by 10% each year. • Write the exponent decay model? • Find the value after 3 years • Graph the model • Find when the value of the snowmobile will be $2500 • Solution:
Thursday April 24, 2014 7.3 Exponential Growth Functions Objective: To solve and graph polynomial and radical functions EQ: Can you graph an exponential function? What is the Euler number or the Natural Base e? Example:
Thursday April 24, 2014 7.3 Exponential Growth Functions Calculating Compounded Interest? Example: You have a $4,000,000 in an account that pay 6% annual interest compounded continuously. What is the balance after 1 year? Solution: Compound annually A = P [1+ (.06)] 0.06 = Compound quarterly A = P [1+ (.06/4)] 06(4) = Compound monthly A = P [1+ (.06/12)] 06(12) = Compound daily A = P [1+ (.06/365)] 06(365) = Compound continuously: A = Pert = 4000e.06(1) =
Friday May 2, 2014 Rewrite the followings in exponential form (use whole numbers, both positive or negative) 8 = 0 = 12 = ¼ =
Thursday April 24, 2014 7.4 Evaluate and Graph Logarithm Functions Objective: To solve and graph polynomial and radical functions EQ: How do exponent and logarithm functions relate? Definition Example: Example:
Thursday April 24, 2014 7.4 Evaluate and Graph Logarithm Functions Inverse Functions: f(x) = bx is the inverse function of g(x) = logbx Therefor: Example: Example:
Thursday April 24, 2014 7.4 Evaluate and Graph Logarithm Functions Parent Graphs for Logarithmic Functions: Example:
Thursday April 24, 2014 7.4 Evaluate and Graph Logarithm Functions Translations in Logarithmic Function Graph: From the parent function: y = logbx to y = logb(x – h) + k (the graph moves h units to the right and k units up) Example: y = logb(x + 3) + 1 Solution: