Download
1 / 21
210 likes | 349 Vues
Estimation of ensemble pdfs, cdfs, and moments from limited sampling of random fields. Stochastic Subsurface Hydrology CWR 6536. Estimation of ensemble moments from field data. Assume that random field is constructed of the following components:

E N D
Estimation of ensemble pdfs, cdfs, and moments from limited sampling of random fields Stochastic Subsurface Hydrology CWR 6536
Estimation of ensemble moments from field data • Assume that random field is constructed of the following components: • If only one replicate available, use visualization techniques to look for possible non-stationary behavior in space. • If multiple replicates available (typically over time) can properly analyze for non-stationary moments
Estimating a stationary mean • Estimator of the mean: • Estimate is itself a random variable because it depends on both the number of observations and the values of the observations
Properties of Good Estimators • Unbiased • Consistent • Efficient
It can be shown that the sample mean calculated using standard estimator is unbiased for any sequence of independent identically distributed r.v.s with finite mean and variance • It also can be shown that the standard estimator is consistent and the most efficient estimator of the population mean
Analyzing data with an apparent mean trend • Is there a physical reason for the trend? If so postulate a physical model for the mean trend • Is there a change in geology or soil structure which might allow you to break the region up into stationary subregions? • Can you fit a line, plane, polynomial through the observed data? • Examples?
Analyzing data with an apparent mean trend • A similar method to fitting functions to observed trends is to difference data in space or time over an equal interval • Very popular method in traditional geostatistics
Analyzing data with an apparent mean trend • Once non-stationary mean has been identified, subtract mean (or trend) from the observation and examine residual series for stationarity • If mean of residual series is stationary proceed to determine estimate variance, covariance, pdf, cdf.
Estimating the variance of a stationary random field • Estimating the variance from multiple replicates of a non-stationary random field • What if multiple replicates are not available and we suspect a non-stationary variance?
Estimating the covariance of a stationary random field • Estimating the covariance of a non-stationary random field
Estimating the cross-covariance of a stationary random field • Estimating the cross-covariance of a non-stationary random field
Estimating the variogram of a stationary random field Note: presence of a sill in sample variogram confirms second order stationarity • Estimating the variogram of a non-stationary random field
Estimating the cross-variogram of a stationary random field • Estimating the cross-variogram of a non-stationary random field • Psuedo cross-variogram
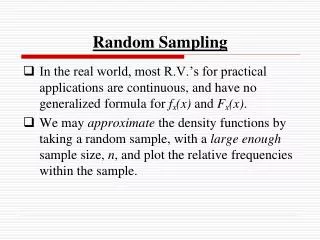
Estimating the sample pdf (or histogram) 1. Group data into 5 to 20 class intervals depending on how much data is available. Must have at least 1 observation in each class, preferably a minimum of 5. 2. Determine frequency of finding observation in a particular class 3. Area under the histogram (frequency vs class) is now 1. This corresponds to the sample pdf.
Estimating the sample cdf 1. Rank total number (N) of observations of random variable (xi) from smallest to largest. 2. Where m(xi) is rank of observation xi
Compare sample cdfs and pdfs to theoretical cdf and pdf functions to determine possible analytical distribution functions. Use hypothesis testing (chi-squared, Kolmogorov-Smirnov) to test fit to analytic functions • If data is symmetric and doesn’t show significant skewness test for normality. Normal distributions have many desirable properties. • However…most earth science data have asymmetric, skewed distributions. A few very small or large values may strongly affect summary statistics such as the mean & variance, and measures of spatial continuity. Therefore these extreme values must be evaluated carefully.
Dealing with Extreme Values • Declare the extreme values erroneous and discard them (must be done cautiously!) • Classify the extreme values into a separate statistical population (particularly if the values are spatially clustered) • Transform the data to reduce the influence of extreme values, e.g. take the square root or logarithm of the data. Log transformation is desirable because taking the log reduces the range of variability. • Use a normal score transform
Normal Score Transform • Estimate the sample cdf, , by ranking the observations xand dividing by number of samples, N (or N +1) • The normal score transform of observation with rank m and magnitudexmis matched to the corresponding exceedance probability for the standard normal cdf
Analyzing Categorical Data • Recall definition of categorical r.v. • An observation, s(z), that can take on any of a finite number of mutually exclusive, exhaustive states (sk) , e.g. soil type, land use, landscape position • For categorical r.v. define indicator transform: • For these indicator transform variables the mean, covariance, semi-variogram, cross-covariance and cross-variogram can be defined
Other Indicator Transforms • Sometimes the pattern of spatial continuity of an attribute can vary depending on the magnitude of the attribute. This can be analyzed by defining the indicator transform: where various levels of threshold values xk can be used • For these indicator transform variables the mean, covariance, semi-variogram, cross-covariance and cross-variogram can also be defined
Analyzing Indicator Data • Mean • Covariance • Semivariogram • Cross-covariance • Cross-semivariogram