Mapping Earth Midterm Review
200 likes | 221 Vues
Learn how to read and draw isolines, understand topography using contour maps, find intervals, identify hills and slopes, determine river direction, and interpret maximum/minimum elevations. Practice with examples.

Mapping Earth Midterm Review
E N D
Presentation Transcript
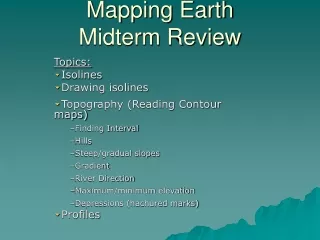
Mapping Earth Midterm Review Topics: Isolines Drawing isolines Topography (Reading Contour maps) Finding Interval Hills Steep/gradual slopes Gradient River Direction Maximum/minimum elevation Depressions (hachured marks) Profiles
Isolines • Connect points of equal value • Isotherm: temperature • Isobars: barometric (air pressure) • Contour lines: elevation
Drawing Isolines • Connect the points with the same value • Estimate between which other values the line should be drawn • Lines should be curved, not angular • Extend lines to edge of map • Never cross isolines
Topography (Contour maps) • 1-dimensional representation of a 3D landscape • Shows the shape of the land
Finding Interval • Difference between one contour line and the next • May be given on map • Labeled lines are Index Contours
Subtract the value of two consecutive Index Contour Lines • Then count how many contour lines there are from one Index Contour to the next (only count one of the Index Contours) • Divide the difference by the # of lines 300-200=100m 5 lines 100/5= 20m
Hills • Hills or mountains are shown by contour lines that form closed loops
Steep/gradual slopes • Steep Slope: contour lines are close together • Gradual Slope: contour lines are far apart
Gradient Difference in Elevation Distance between two points • Label with given units!
River Direction • Contour lines bend upstream
Depressions (hachured marks) • The first hachured line is the same value as the last contour line. • Each hachured line decreases by the contour interval
Ocean= • Interval = • 1st Hachured line = 20 • Elevation at point A= 0 10 10
Inferring Maximum/minimum elevation • Max: Value just below what the next contour line would equal Z= • Min: Value just above what the next contour line would equal Y= • Z 99 ft • Y 21 ft
Maximum Elevation • Represented by Triangle symbol
Profiles • Cross section (side view) of the contour map • Use mark and slide method • Keep a STEADY hand • No numbers on x-axis • Use contour interval on Y-axis
What is the max elevation at point E? What direction is Mud Creek flowing? 139 20 What is the contour interval? SE