Download
1 / 32
410 likes | 1.02k Vues
The Powers of Fault Tree Analysis. Bill Vesely Office of Safety and Mission Assurance NASA Headquarters. Fault Tree Analysis: a Systematic and Stylized Deductive Process. An undesired event is defined The event is resolved into its immediate causes

E N D
The Powers of Fault Tree Analysis Bill Vesely Office of Safety and Mission Assurance NASA Headquarters
Fault Tree Analysis: a Systematic and Stylized Deductive Process • An undesired event is defined • The event is resolved into its immediate causes • This resolution of events continues until basic causes are identified • A logical diagram called a fault tree is constructed in the process of carrying out the analysis
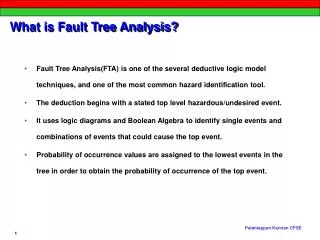
Why Fault Tree Analysis (FTA) is carried out • To gain an understanding of the system • To document the failure relationships of the system • To exhaustively identify the causes of a failure • To assure compliance with requirements or a goal • To identify any weaknesses in a system • To prioritize contributors to failure • To identify effective upgrades to a system • To optimize operations and processing • To quantify the failure probability and contributors
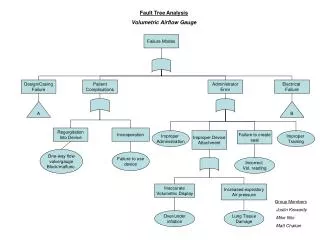
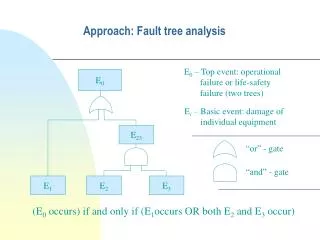
The Fault Tree • FTA produces a Fault Tree. • The fault tree is the logical model of the relationship of the undesired event to more basic events. • The top event of the fault tree is the undesired event. • The middle events are intermediate events. • The bottom of the fault tree is the causal basic events or primary events. • The logical relationships of the events are shown by logical symbols or gates.
Basic Fault Tree Structure Top Undesired Event Logic Gates Intermediate Events Basic Events
A Typical Fault Tree
Applications of FTA • Prioritization of Contributors for Resource Allocation • Development of a Design • Determination of Effective Tradeoffs • Resolution of Causes for Mishap Analysis • Demonstration of Compliance with Single Failure Criteria • Establishment of Contingency Criteria • Monitoring and Tracking of Performance
The Power of FTA in Prioritizing Failure Contributors • Each basic event in the fault tree can be prioritized for its importance to the top event • Different importance measures are obtained for different applications • Basic events generally are ordered by orders of magnitude in their importance. • In addition to each basic event, every intermediate event in the FT can be prioritized for its importance • As a general rule, less than 20% of the contributors result in more than 90% of the risk.
Basic Fault Tree Importance Measures FV Importance = Relative contribution to the system failure probability from a component failure RAW = Factor increase in the system failure probability when a component is assumed to be failed RRW = Factor decrease in the system failure probability when a component is assumed to succeed FV Importance =“Fussell-Vesely Importance” RAW = “Risk Achievement Worth” RRW =“Risk Reduction Worth”
Basic Causal Importances for a Monopropellant System FV Importance RRW Factor RAW Factor (Increase) Basic Causal Event (Contribution) (Reduction) Human Error Failure to 99.3% 143 100 Open Switch S3 Timer K6 Fail to Time Out 86.7% 7.5 43 Relay K6 Fail to Open 13% 1.15 43 Switch S3 Fail to Open 0.5% 1.01 100 Isolation Valve IV2 Fail to 0.3% 1.00 13 Close Relay K3 Fail to Open 0.3% 1.00 1.00 Isolation Valve IV3 Fail to 0.01% 1.00 1.00 Close
Uses of the Importance Measures • Focus system safety on the top contributors (FV) • Review possible relaxations for the lowest contributors (FV, RAW) • Focus on upgrades having the greatest improvements (RRW) • Define contingency measures to be consistent with the failure impact (RAW) • Establish assurance requirements to be consistent with their importance (FV, RAW)
Examples of Importance Evaluations in the Space Shuttle PRA • Over a million individual events are modeled in the Shuttle PRA and 97% of the calculated risk resides in approximately 308 events. • Approximately 15% or more of the calculated risk is due to fluid leaks that lead to fire and explosion. This can change based on current updating of the Shuttle PRA • Abort risk is insignificant to mission risk (<1%).
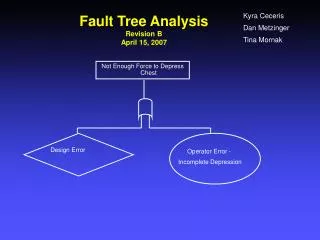
The Use of FTA in Mishap Analysis • The accident scenario is constructed for the mishap • System failures (pivotal events) are identified which resulted in the mishap • A fault tree is constructed for each system failure to resolve the basic events involved • Root cause analysis is carried out by further resolving a basic event into its root causes • The basic events and root causes are dispositioned into their importances and actions required
LOSS OF OML DUE TO PAILURE SOURCE INTERNAL TO PAYLOAD BAY SFOML-INTPLB The Columbia Fault Tree LOCV DURING ENTRY DUE TO AERODYNAMIC BREAKUP LOCV AERODYNAMIC AERODYNAMIC BREAKUP DUE TO BREAKUP DUE TO IMPROPER ATTITUDE STRUCTURAL FAILURE / TRAJECTORY OF THE ORBITER CONTROL 36 AC SF STRUCTURAL FAILURE LOSS OF AERODYNAMIC OF ORBITER DUE CHARACTERISTICS TO LOSS OF STRUCTURAL DUE TO LOSS OF MEMBER OUTER MOLD LINE (OML) 34 SFSM SFOML LOSS OF OML LOSS OF OML LOSS OF OML LOSS OF OML LOSS OF OML LOSS OF OML DUE TO WING/ELEVON DUE TO AFT FUSELAGE DUE TO PAYLOAD DUE TO CREW CABIN DUE TO BODY FLAP DUE TO FRCS STRUCTURAL STRUCTURAL FAILURE FAILURE BAY DOOR FAILURE MODULE FAILURE FAILURE FAILURE 2 SFOML-WING SFOML-AFT SFOML-BAY SFOML-CABIN SFOML-FLAP SFOML-FRCS LOSS OF OML LOSS OF OML LOSS OF OML LOSS OF OML LOSS OF OML DUE TO FWD FUSELAGE DUE TO MID FUSELAGE DUE TO OMS POD DUE TO WINDOW DUE TO TAIL FAILURE FAILURE FAILURE FAILURE FAILURE SFOML-FWD SFOML-MID SFOML-OMS SFOML-TAIL SFOML-WINDOW LOSS OF OML DUE TO SSME OUT OF CONFIGURATION (ME) SFOML-SSME LOCV - LOCV DURING ENTRY DUE TO AERODYNAMIC BREAKUP 2003/04/18 Page 1
The Columbia Fault Tree Continued LOSS OF OML DUE TO WING/ELEVON STRUCTURAL FAILURE SFOML-WING WING/ELEVON WING/ELEVON WING/ELEVON WING/ELEVON STRUCTURAL FAILURE STRUCTURAL FAILURE STRUCTURAL FAILURE STRUCTURAL FAILURE DUE TO OVERPRESSURIZATION DUE TO THERMAL DUE TO WEAKENED DUE TO WING OVERLOAD OR COLLAPSE DAMAGE BURN THROUGH WING STRUCTURE 21 4 23 SFOML-WING-5-1 SFOML-WING-5-2 SFOML-WING-5-3 SFOML-WING-5-4 WING OVERPRESS OR COLLAPSE DUE TO PRESSURE SYSTEM FAILURE CAUSING INADVERTENT PRESS WING OVERPRESS OR COLLAPSE DUE TO BLOCKED VENT RESULTING IN FAILURE TO REPRESS WING OVERPRESS OR COLLAPSE DUE TO BLOWN TIRE CAUSING INADVERTENT PRESSURIZATION WING OVERPRESS OR COLLAPSE DUE TO PAYLOAD BAY SOURCE (ME) SFOML-WING-6-6 SFOML-WING-6-18 SFOML-WING-6-5 SFOML-WING-6-7 INADVERTENT INADVERTENT PRESSURIZATION PRESSURIZATION DUE TO PRSD/ECLSS DUE TO OTHER TANK FAILURE EVENT 3 SFOML-WING-7-12 SFOML-WING-7-13 SFOML-WING - LOSS OF OML DUE TO WING/ELEVON STRUCTURAL FAILURE 2003/04/18 Page 2
The Columbia Fault Tree Continued WING/ELEVON STRUCTURAL FAILURE DUE TO THERMAL DAMAGE BURN THROUGH SFOML-WING-5-3 OVERHEAT/ THERMAL DAMAGE/BURN THROUGH DUE TO INADVERTENT OPENING IN WING ALLOWING PLASMA FLOW OVERHEAT/BURN THROUGH DUE TO TPS MALFUNCTION THERMAL DAMAGE BURN THROUGH DUE TO HIGHER HEATING 6 SFOML-WING-6-10 SFOML-WING-6-9 SFOML-WING-6-8 INADVERTENT OPENING IN WING ALLOWING PLASMA FLOW DUE TO FLIPPER DOOR FAILURE INADVERTENT DOOR OPEN OR BREACH OF THERMAL SEAL (GEAR REMAINS UP) TPS MALFUNCTION TPS MALFUNCTION TPS MALFUNCTION TPS MALFUNCTION DUE TO REINFORCED DUE TO BLANKET DUE TO TILE FAILURE DUE TO SEAL FAILURE CARBON-CARBON FAILURE (RCC) FAILURE 8 18 20 SFOML-WING-7-20 SFOML-WING-7-21 SFOML-WING-7-22 SFOML-WING-7-23 SFOML-WING-7-18 SFOML-WING-7-19 SEAL FAILURE SEAL FAILURE SEAL FAILURE DUE TO THERMAL DUE TO ENVIRONMENTAL DUE TO ELEVON BARRIER FAILURE SEAL FAILURE COVE SEAL FAILURE 7 SFOML-WING-8-22 SFOML-WING-8-24 SFOML-WING-8-23 THERMAL BARRIER FAILURE DUE TO LANDING GEAR THERMAL BARRIER FAILURE THERMAL BARRIER FAILURE DUE TO ET UMBILICAL DOOR THERMAL BARRIER FAILURE 5 SFOML-WING-9-32 SFOML-WING-9-33 LANDING GEAR THERMAL BARRIER FAILURE DUE TO FLIGHT OUTSIDE ENVELOPE (ME) LANDING GEAR THERMAL BARRIER FAILURE DUE TO DEGRADATION OF THERMAL BARRIER LANDING GEAR THERMAL BARRIER FAILURE DUE TO INSTALL/CLOSING IMPACT SNEAK FLOW 12 11 SFOML-WING-10-48 SFOML-WING-9-24 SFOML-WING-10-18 SFOML-WING-9-46 SFOML-WING-10-17 SFOML-WING-5-3 - WING/ELEVON STRUCTURAL FAILURE DUE TO THERMAL DAMAGE BURN THROUGH 2003/04/18 Page 4
The Columbia Fault Tree Continued INFLIGHT IMPACT ON ASCENT SFOML-WING-10-3 LIFT OFF (PAD DEBRIS) IMPACT (ME) ORBITER CAUSED INFLIGHT IMPACT ON ASCENT RSRM DEBRIS IMPACT ON ASCENT (ME) ET DEBRIS IMPACTON ASCENT (ME) SSME DEBRIS IMPACT (ME) SRB DEBRIS IMPACT ON ASCENT (ME) SFOML-WING-11-5 SFOML-WING-11-6 SFOML-WING-11-64 SFOML-WING-11-8 SFOML-WING-11-18 SFOML-WING-11-7 FOD ORBITER HARDWARE SFOML-WING-12-25 SFOML-WING-12-24 ORBITER ACCESS PANEL TPS IMPACTS ORBITER SFOML-WING-11-60 SFOML-WING-11-61 SFOML-WING-10-3 - INFLIGHT IMPACT ON ASCENT 2003/04/18 Page 15
The Use of FTA in Design • To evaluate a Design, a top level fault tree is developed • Functional level • System level • Subsystem level • Tradeoffs are carried out • Alternative functional capabilities • Alternative redundancies • Allocations are performed • System requirement into subsystem requirements • Subsystem requirements into component requirements
Redundant Seal Design Allocation Considering Independent Failures
Redundant Seal Design Allocation Including Common Cause Failures
The Fault Tree as a Master Logic Diagram • The Master Logic Diagram (MLD) is a fault tree identifying all the hazards affecting a system or mission • The Master Logic Diagram can also be called a Master Hazards Diagram (MHD) • The MLD or MHD is developed using fault tree logic • The basic events of a system MHD are the hazards that can initiate component failures or increase their likelihood • The basic events of a mission MLD are the hazards that are the initiating events of potential accident scenarios
Extending a System Fault Tree to a Master Hazard Diagram (MHD) • The top event is defined as a system failure event • The fault tree is developed to the basic component level • Each component failure is further resolved into hazards and conditions that can cause failure or increase its likelihood • The resulting system MHD identifies the hazards affecting the system and their consequences • Of particular importance are single failures and hazards affecting multiple redundant components
Ranking the Criticality of Hazards Using FTA • Each hazard is linked to a basic event or events on the fault tree • Equivalently each hazard is linked to the basic events in the minimal cutsets • The criticality of the hazard is the likelihood of the hazard times the importance of the basic event • The component importance is determined from the FTA • The likelihood is determined from the hazard analysis Hazard Criticality=Likelihood x Importance of Components Affected
Activated Manually * Challenged by Collision Challenged by Manual Action Equipment Failure Disabled/Challenged by Human Error Mission MIR HABITABILITY * Page 2 Critical Functions Attitude Control Pressure Control * Tasks Isolate Compartments Emergency Isolation Activate & Monitor Attitude Control Maintain Pressure Boundary * Resources External Skin * Internal Hatches Emergency Hatches Gyrodynes Automatic Control Mir Thrusters Progress Thrusters Support Systems Progress Electric Power (Page 4) Fuel Attitude Control Computer Fuel Fuel
Page 1 Page 3 Activate and Monitor Oxygen Supply Lithium Hydroxide Equipment Cooling VGR MIR HABITABILITY * Oxygen Generation CO2 Control Activate and Monitor CO2 Control Oxygen “Candles” Oxygen Bottles Vozdukh “Other Russian Systems” Elektron Generator Electric Power (Page 4) Progress Electric Power (Page 4) Vacuum Control Valve Bypass
The Mirror Success Tree (ST) • A Success Tree (ST) identifies all the ways in which the top event cannot occur • The ST is the complement of the FT • The ST is the mirror of the FT • The ST is useful in showing the explicit ways to prevent the occurrence of the FT • The ST is the success space twin of the FT
Developing the Success Tree from the Fault Tree • Complement the top event to a NOT event • Complement all intermediate events to NOT events • Complement all basic events to NOT events • Change all AND gates to OR gates • Change all OR gates to AND gates • The tree is now the ST • The minimal cut sets of the ST are now called the minimal path sets
The Minimal Path Sets Define the Success Modes of the System • A minimal path set is the smallest number of events which if they all do not occur then the top event will not occur • If the events in one path set are prevented to occur then the top event will be guaranteed to not occur • The minimal path sets are the totality of ways to prevent the top event based on the fault tree • The minimal paths should be determined as a part of a fault tree analysis
FTA Project Management Tasks (1) • Define the FTA • Top Event • Scope • Resolution • Assemble the project Team • FT analyst • System engineering support • Data support • Software support • Define the FTA Operational Framework • Assemble the as built drawings • FT naming scheme • Interfaces/Support to be modeled • Software to be used
FTA Project Management Tasks (2) • Assemble the data • Generically applicable data • Specifically applicable data • Prepare the software package • Familiarization • Test problems • Keep a log on the FTA work • Operational and design assumptions • Events not modeled and why • Success and failure definitions • Special models and quantifications used
FTA Project Management Tasks (3) • Review the work at stages • FT construction • Qualitative evaluations • Quantitative evaluations • Check and validate the results • Engineering logic checks • Consistency checks with experience • Prepare and disseminate the draft report • Conclusions/findings • FTA results • FTs • Software inputs/outputs • Obtain feedback and modify and final report • Disseminate the report • Present findings
Reference • “Fault Tree Handbook with Aerospace Applications’, Version 1.1, NASA Publication, August 2002.