Review for Final Part 1, chapter 1-5
1.28k likes | 1.54k Vues
Review for Final Part 1, chapter 1-5. Exam is Monday May 8, 5 pm. in our regular room Or you may take it early, Friday, May 5, 8 a.m. Comer 311. Please send me an email if you think you might take it on May 5 so I will have enough exams. Final is comprehensive.

Review for Final Part 1, chapter 1-5
E N D
Presentation Transcript
Review for FinalPart 1, chapter 1-5 Exam is Monday May 8, 5 pm. in our regular room Or you may take it early, Friday, May 5, 8 a.m. Comer 311. Please send me an email if you think you might take it on May 5 so I will have enough exams.
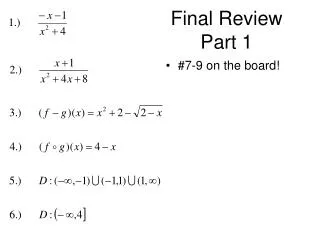
Final is comprehensive • Material is covered fairly evenly from all four units. • Many multiple choice questions are similar to, but usually not identical to, the ones you've seen. • Problems will look like ones you've seen before on paper homework or exams, but with different numbers.
Format of Final? 35 multiple choice questions, worth 2 points each. (70 points) 30 points of short problems. You don't need a Scantron. You do need a calculator.
Review, Part 1 • PPF • Economic Role of Government • Types of Economies • Markets • Supply, Demand, Price Determination • Elasticity and Total Revenue
What is economics? • Economics is a social science. • Social sciences deal with people and the institutions they create. • Economics deals with how people make decisions to allocate resources to achieve their goals.
Scarcity and Efficiency • Scarcity. Resources are (usually) finite. • All “economic goods” are limited in supply, which economists call “scarce.” • In a market economy, “scarce” or limited items have prices associated with them. • The notion of “unlimited” wants is not true for everyone, but even at our current level of prosperity, we do not produce enough for everyone to think they have “enough.”
Economic Efficiency The economy is producing “efficiently” when it cannot increase the economic welfare of anyone without making at least one person worse off.
Equity Equity involves the distribution of wealth within a society. In perfect equity, everyone has equal shares.
Microeconomics . . . is the branch of economics that deals with the behavior of individual entities, such as consumers, firms, households, or markets. A major focus of microeconomics is price determination.
The other branch of Economics . . . is macroeconomics, which is concerned with overall performance of the economy, e.g. inflation, unemployment, growth.
Common Logical Fallacies • “Post hoc” fallacy occurs when people assume that because one event follows another, the first event caused the second. • The “fallacy of composition” occurs when we assume that what holds true for part of a system also holds true for the whole.
Positive and Normative Economics • Positive Economics deals with questions that can be analyzed objectively, e.g. “What is the impact of raising taxes?” • Normative Economics involves ethical precepts and norms of fairness, e.g. “Should the poor be required to work to receive government assistance?”
Types of Economies • Command Economy: government makes all important decisions about production and distribution. • Market Economy: individuals and private firms make the major decisions. Extreme case (no government intervention) is called “laissez-faire” economy. • Mixed Economy has elements of both. All modern economies are mixed.
Production Possibilities Frontier PPF shows the possible combinations of two or more goods that an economy could produce with its resources.
Opportunity Cost The value of items not produced because resources were used for another purpose.
A Market A market is a mechanism by which buyers and sellers interact to determine the price and quantity of a good or service. A market need not be a physical place.
The Market Mechanism A market economy is an elaborate mechanism for coordinating people, activities, and businesses through a system of prices and markets. In a market economy, no single individual or organization is responsible for production, consumption, and distribution.
Price Determination In a market economy, prices are determined in the marketplace, by consumers and producers. If consumers want more of a good (e.g. gasoline in the summer), the price will rise, encouraging increased production. If a product is overstocked, prices fall, encouraging more sales.
Role of Prices Prices coordinate the decisions of producers and consumers in a market. Higher prices tend to reduce consumer purchases and encourage production. Lower prices encourage consumption and discourage production. Prices are the balance wheel in the market mechanism. .
Market Equilibrium A market is in equilibrium when the commodity is neither in glut nor shortage at the prevailing price. A market equilibrium is a balance among all the different buyers and sellers.
The Hand Invisible The orderliness of the market system led Adam Smith to coin the phrase “the invisible hand.”
Advanced Capitalist Economies • Characterized by trade and specialization. • Extensive use of money. • Vast quantities of capital used for production.
Specialization, division of labor, and gains from trade • Specialization occurs when people or countries can concentrate on the items that can be produced most efficiently. • A division of labor allows individuals to perform the tasks they do best. • Because of specialization and division of labor, we experience gains from trade.
Three Factors of Production Land and labor are primary factors of production. Their supply is mostly determined by non-economic factors. Capital items, on the other hand, need to be produced or manufactured. Thus, they are both inputs (for further production) and outputs.
Three Main Economic Functions of Government • Increase efficiency by promoting competition, curbing externalities, and providing public goods. • Promote equity by using tax and expenditure programs to redistribute income. • Foster macroeconomic stability and growth through fiscal policy and regulation.
Promoting Competition • If a single buyer or seller can affect price the market is characterized by imperfect competition. • Imperfect competition leads to prices above cost and reduced efficiency.
Curbing Externalities Externalities are either costs affecting people who are not compensated for them (e.g. pollution), or benefits accruing to people who do not pay for them (an existing restaurant benefiting from the construction of new shopping mall next door). A difference between private and social costs and benefits.
Providing Public Goods Commodities that can benefit many people without being “used up.” The value (usually) cannot be easily divided, as there are benefits to the entire community. Examples: Public schools, parks, public health programs, highways, national defense.
Policies to reduce inequalities • Progressive taxation, higher tax rates for higher incomes • Transfer payments, “the safety net.” • Minimum wage laws.
Fostering Growth and Stability Governments now use monetary and fiscal policy to influence level of total spending, rate of growth, levels of unemployment, and the inflation rate. Monetary policy refers to the interest rate and the money supply. Fiscal policy refers to taxes and government spending.
Supply, Demand, Price from chapters 3 and 4
The Demand Schedule The demand schedule (demand curve) shows the relationship between a commodity’s market price and the quantity of that commodity that consumers are willing and able to purchase, other things held constant.
Factors Affecting Demand • Size of market, e.g. how many consumers. • Income levels of consumers. • Prices and availability of related goods. • Tastes and preferences. • Special influences, e.g. climate and conditions.
Change in Demand Demand curves will shift, as income, other prices, market size, or tastes or preferences change.
Movement along the demand curve Movement along the demand curve occurs as the good’s own price changes. P As price falls, a greater quantity is demanded. Q
Shifts in Demand Shifts in the demand curve take place if one of the factors behind the demand curve changes: income, prices of available goods, tastes or preferences, or special influences.
The Supply Schedule The supply schedule (or supply curve) for a commodity shows the relationship between the market price and the amount of that commodity that producers are willing and able to produce and sell, other things held constant.
Market Supply To get market supply, sum the quantities supplied by all the individual firms at each price level.
Supply Shifters • Changes in costs of inputs • Technological change • Government policy • Special factors (climate, culture)
Movement along supply curve P S As price rises, all other things held constant, the quantity supplied increases. Q
Shift of supply curve P If the price of an input falls, the supply curve shifts out. S S’ Q
S S' D A shift in Supply causes a movement along the demand curve. Demand doesn't change but quantity demanded changes because of the price change.
S D D' A shift in Demand causes a movement along the supply curve. Supply doesn't change but quantity supplied changes because of the price change.
Market Equilibrium A market equilibrium comes at the place where quantity demanded equals quantity supplied. Equilibrium takes place at the intersection of the supply and demand curves.
Graphical Representation of Equilibrium . . 5 . S P Surplus . . . 4 . Equilibrium 3 . . . 2 Shortage . . 1 D . . . . Q 5 15 20 10
Shifts in curves change equilibrium Supply increases Price down, Quantity up. P S S’ P P D Q Q’ Q
Shifts in curves change equilibrium Supply decreases Price Up Quantity Down P S’ S P’ P D Q Q Q’
Shifts in curves change equilibrium Demand Increases P S (Note that TR increases because both P and Q increase.) P” P’ D” D’ Q Q’ Q”
Shifts in curves change equilibrium P S Demand Decreases (Note that TR falls because both P and Q fall.) P’ P” D’ D” Q Q” Q’
Four Possible Outcomes • Supply decrease: Price Up, Quantity Down • Supply increase: Price Down, Quantity Up • Demand increase: Price Up, Quantity Up • Demand decrease: Price Down, Quantity Down