1 / 12

Peak-Fitting

Peak-Fitting. This slide show presents a Step-by-Step view of a simple peak-fit We first define the number of “data” points to define the end points Then we use the mouse cursor to define the baseline end points Next we choose one of 3 different baseline shapes (use the icons)

ylopez
Télécharger la présentation

Peak-Fitting

An Image/Link below is provided (as is) to download presentation Download Policy: Content on the Website is provided to you AS IS for your information and personal use and may not be sold / licensed / shared on other websites without getting consent from its author. Content is provided to you AS IS for your information and personal use only. Download presentation by click this link. While downloading, if for some reason you are not able to download a presentation, the publisher may have deleted the file from their server. During download, if you can't get a presentation, the file might be deleted by the publisher.

E N D

Presentation Transcript


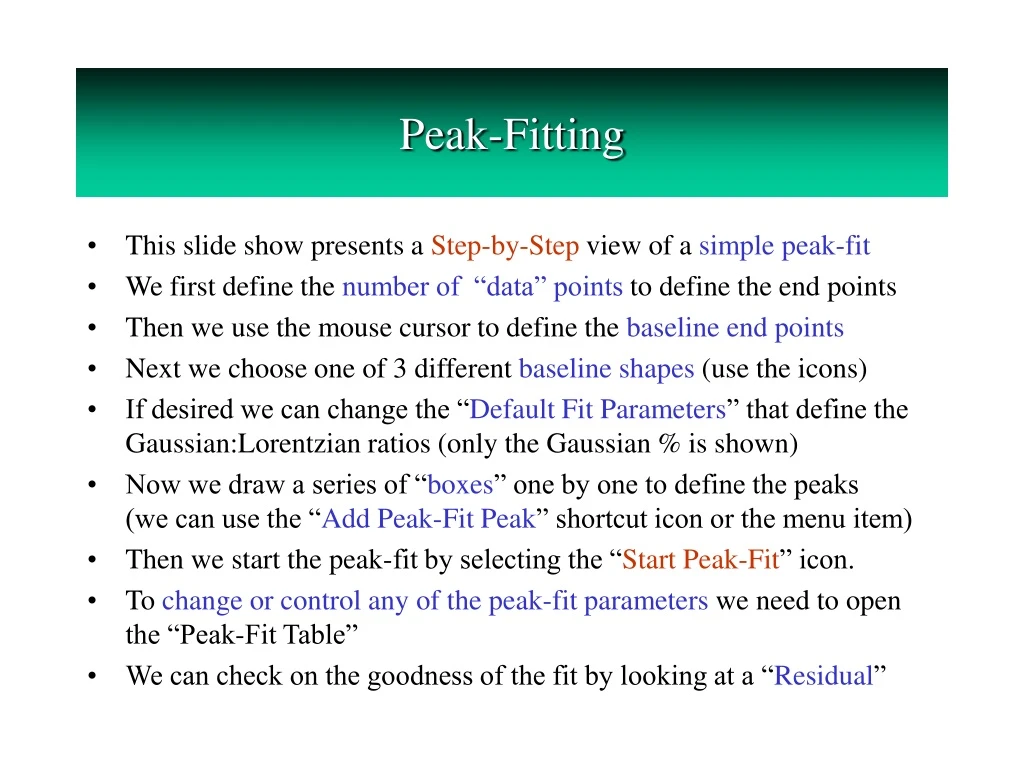
  1. Peak-Fitting • This slide show presents a Step-by-Step view of a simple peak-fit • We first define the number of “data” points to define the end points • Then we use the mouse cursor to define the baseline end points • Next we choose one of 3 different baseline shapes (use the icons) • If desired we can change the “Default Fit Parameters” that define the Gaussian:Lorentzian ratios (only the Gaussian % is shown) • Now we draw a series of “boxes” one by one to define the peaks (we can use the “Add Peak-Fit Peak” shortcut icon or the menu item) • Then we start the peak-fit by selecting the “Start Peak-Fit” icon. • To change or control any of the peak-fit parameters we need to open the “Peak-Fit Table” • We can check on the goodness of the fit by looking at a “Residual”

More Related