Download
1 / 37
390 likes | 542 Vues
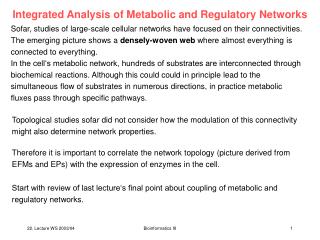
Integrated Analysis of Metabolic and Regulatory Networks. Sofar, studies of large-scale cellular networks have focused on their connectivities. The emerging picture shows a densely-woven web where almost everything is connected to everything.

E N D
Integrated Analysis of Metabolic and Regulatory Networks Sofar, studies of large-scale cellular networks have focused on their connectivities. The emerging picture shows a densely-woven web where almost everything is connected to everything. In the cell‘s metabolic network, hundreds of substrates are interconnected through biochemical reactions. Although this could could in principle lead to the simultaneous flow of substrates in numerous directions, in practice metabolic fluxes pass through specific pathways. Topological studies sofar did not consider how the modulation of this connectivity might also determine network properties. Therefore it is important to correlate the network topology (picture derived from EFMs and EPs) with the expression of enzymes in the cell. Start with review of last lecture‘s final point about coupling of metabolic and regulatory networks. Bioinformatics III
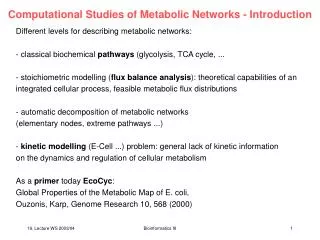
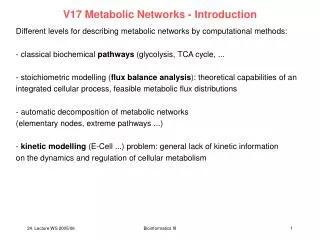
Application of elementary modesMetabolic network structure of E.coli determineskey aspects of functionality and regulation Compute EFMs for central metabolism of E.coli. Catabolic part: substrate uptake reactions, glycolysis, pentose phosphate pathway, TCA cycle, excretion of by-products (acetate, formate, lactate, ethanol) Anabolic part: conversions of precursors into building blocks like amino acids, to macromolecules, and to biomass. Stelling et al. Nature 420, 190 (2002) Bioinformatics III
Robustness analysis The # of EFMs qualitatively indicates whether a mutant is viable or not, but does not describe quantitatively how well a mutant grows. Define maximal biomass yield Ymass as the optimum of: eiis the single reaction rate (growth and substrate uptake) in EFM i selected for utilization of substrate Sk. Stelling et al. Nature 420, 190 (2002) Bioinformatics III
Can regulation be predicted by EFM analysis? Compute control-effective fluxes for each reaction l by determining the efficiency of any EFM eiby relating the system‘s output to the substrate uptake and to the sum of all absolute fluxes. With flux modes normalized to the total substrate uptake, efficiencies i(Sk, ) for the targets for optimization -growth and ATP generation, are defined as: Control-effective fluxes vl(Sk) are obtained by averaged weighting of the product of reaction-specific fluxes and mode-specific efficiencies over all EFMs using the substrate under consideration: YmaxX/Si and YmaxA/Si are optimal yields of biomass production and of ATP synthesis. Control-effective fluxes represent the importance of each reaction for efficient and flexible operation of the entire network. Stelling et al. Nature 420, 190 (2002) Bioinformatics III
Prediction of gene expression patterns As cellular control on longer timescales is predominantly achieved by genetic regulation, the control-effective fluxes should correlate with messenger RNA levels. Compute theoretical transcript ratios (S1,S2) for growth on two alternative substrates S1 and S2 as ratios of control-effective fluxes. Compare to exp. DNA-microarray data for E.coli growing on glucose and acetate. Excellent correlation! Stelling et al. Nature 420, 190 (2002) Calculated ratios between gene expression levels during exponential growth on acetate and exponential growth on glucose (filled circles indicate outliers) based on all elementary modes versus experimentally determined transcript ratios. Lines indicate 95% confidence intervals for experimental data (horizontal lines), linear regression (solid line), perfect match (dashed line) and two-fold deviation (dotted line). Bioinformatics III
Analyze transcriptional control in metabolic networks Regulatory and metabolic functions of cells are mediated by networks of interacting biochemical components. Metabolic flux is optimized to maximize metabolic efficiency under different conditions. Control of metabolic flow: - allosteric interactions - covalent modifications involving enzymatic activity - transcription (revealed by genome-wide expression studies) Here: N. Barkai and colleagues analyzed published experimental expression data of Saccharomyces cerevisae. Ihmels, Levy, Barkai, Nat. Biotech 22, 86 (2004) Bioinformatics III
Recurrence signature algorithm Availability of DNA microarray data study transcriptional response of a complete genome to different experimental conditions. An essential task in studying the global structure of transcriptional networks is the gene classification. Commonly used clustering algorithms classify genes successfully when applied to relatively small data sets, but their application to large-scale expression data is limited by 2 well-recognized drawbacks: - commonly used algorithms assign each gene to a single cluster, whereas in fact genes may participate in several functions and should thus be included in several clusters - these algorithms classify genes on the basis of their expression under all experimental conditions, whereas cellular processes are generally affected only by a small subset of these conditions. Ihmels et al. Nat Genetics 31, 370 (2002) Bioinformatics III
Recurrence signature algorithm Aim: identify transcription „modules“ (TMs). a set of randomly selected genes is unlikely to be identical to the genes of any TM. Yet many such sets do have some overlap with a specific TM. In particular, sets of genes that are compiled according to existing knowledge of their functional (or regulatory) sequence similarity may have a significant overlap with a transcription module. Algorithm receives a gene set that partially overlaps a TM and then provides the complete module as output. Therefore this algorithm is referred to as „signature algorithm“. Ihmels et al. Nat Genetics 31, 370 (2002) Bioinformatics III
Recurrence signature algorithm normalization of data identify modules classify genes into modules a, The signature algorithm. b , Recurrence as a reliability measure. The signature algorithm is applied to distinct input sets containing different subsets of the postulated transcription module. If the different input sets give rise to the same module, it is considered reliable. c, General application of the recurrent signature method. Ihmels et al. Nat Genetics 31, 370 (2002) Bioinformatics III
Normalize expression matrices Collect from literature expression dataset composed of over 1000 conditions, including environmental stresses, profiles of deletion mutants and natural processes such as cell cycle. Element Egc of the gene expression matrix contains the log-expression change of gene g{1, ..., NG} at the experimental conditions c {1, ..., NC} where NG and NCdenote the total number of genes and conditions, respectively. Introduce 2 normalized expression matrices EGgc and ECgc with zero mean and unit variance with respect to genes and conditions where ...x denote the average with respect to x. Ihmels et al. Nat Genetics 31, 370 (2002) Bioinformatics III
Experiment signature SC The input set consists of NIgenes: Score each experimental condition by the average expression change over the genes of the input set. The condition score is: The experiment signatureSC contains those conditions whose absolute score is statistically significant: Here use tC= 2.0 as the condition threshold level and the standard deviation expected for random fluctuations of Ihmels et al. Nat Genetics 31, 370 (2002) Bioinformatics III
Gene Signature SG In the next step, score all genes by the weighted average change in the expression with the experimental signature. The gene score is: The gene signatureSG contains those genes whose absolute score is statistically significant: Here use tG= 3.0 as the gene threshold level and the measured standard deviation G. Ihmels et al. Nat Genetics 31, 370 (2002) Bioinformatics III
Fusion of signatures Apply signature algorithm to reference input set GIrefand to a set of input sets {GI(i)} that are obtained from GIref ( identify robust modules!) Each set contains a fraction of the „wanted“ genes in GI(i)and some unrelated genes that were selected at random. The result is a reference signature Sref and a collection of modified signatures {Si}. The overlap between any of these signatures and the reference signature is defined as where |...| refers to the size of a set and denotes intersection. Ihmels et al. Nat Genetics 31, 370 (2002) Bioinformatics III
Fusion of signatures All signatures Si whose overlap with the reference signature exceeds a certain threshold are included in the set of recurrent signatures The threshold tR must be chosen to be large enough to discriminate against random fluctuations, but small enough to include a significant fraction of signatures. Here, tR= 70%. A module is obtained by selecting only those genes that appear in at least 80% of all signatures in R. Ihmels et al. Nat Genetics 31, 370 (2002) Bioinformatics III
Fusion of signatures Generate modules from recurrent signatures: To fuse pairs of recurrent signatures {Si, Sj} into transcription modules: For each pair, compute the intersect Pij = Si Sjof genes appearing in both signatures as well as the overlap Select the pair signature Pref with the largest associated overlap OLref as the „seed“ of a new module. Assign all pair signatures Pij whose overlap with Pref exceeded a certain fraction tRof OLref to the set of recurrent signatures R : Ihmels et al. Nat Genetics 31, 370 (2002) Bioinformatics III
Fusion of signatures Obtain gene content and scores of the associated module from R. Remove the pairs that were assigned to R from the total „pool“ of pair signatures {Pij}. To avoid identification of more, less-coherent realizations of the same module, remove also those pairs from R that would have been assigned to R for a somewhat lower value of threshold tR unless they had a significant overlap (~75%) with any other pair signature. This process is iterated until all sets are assigned. Ihmels et al. Nat Genetics 31, 370 (2002) Bioinformatics III
Numerical test Apply algorithm to set of Ncore genes that are known to be co-regulated. Then add Nrandrandomly selected genes. The addition of many random genes leaves the output of the signature algorithm essentially unchanged. In detail: A reference set of Ncore co-regulated genes was composed of genes encoding either ribosomal proteins (dashed lines) or proteins involved in amino-acid biosynthesis (dashed/dotted line). The recurrent signature method was applied to this set as follows. First, a collection of input sets was derived by randomly adding genes to the reference set. Second, the signature algorithm was applied to the reference set and to the derived sets; this generates a reference signature and a collection of perturbed signatures, respectively. Last, the overlaps between the reference signature and the perturbed signatures were calculated. Shown is the average overlap as a function of the number of genes added to the reference set. The different lines correspond to different choices of Ncore, shown in parentheses. Ihmels et al. Nat Genetics 31, 370 (2002) Bioinformatics III
Correlation between genes of the same metabolic pathway Distribution of the average correlation between genes assigned to the same metabolic pathway in the KEGG database. The distribution corresponding to random assignment of genes to metabolic pathways of the same size is shown for comparison. Importantly, only genes coding for enzymes were used in the random control. Interpretation: pairs of genes associated with the same metabolic pathway show a similar expression pattern. However, typically only a set of the genes assigned to a given pathway are coregulated. Ihmels, Levy, Barkai, Nat. Biotech 22, 86 (2004) Bioinformatics III
Correlation between genes of the same metabolic pathway Genes of the glycolysis pathway (according KEGG) were clustered and ordered based on the correlation in their expression profiles. Shown here is the matrix of their pair-wise correlations. The cluster of highly correlated genes (orange frame) corresponds to genes that encode the central glycolysis enzymes. The linear arrangement of these genes along the pathway is shown at right. Of the 46 genes assigned to the glycolysis pathway in the KEGG database, only 24 show a correlated expression pattern. In general, the coregulated genes belong to the central pieces of pathways. Ihmels, Levy, Barkai, Nat. Biotech 22, 86 (2004) Bioinformatics III
Coexpressed enzymes often catalyze linear chain of reactions Coregulation between enzymes associated with central metabolic pathways. Each branch corresponds to several enzymes. In the cases shown, only one of the branches downstream of the junction point is coregulated with upstream genes. Interpretation: coexpressed enzymes are often arranged in a linear order, corresponding to a metabolic flow that is directed in a particular direction. Ihmels, Levy, Barkai, Nat. Biotech 22, 86 (2004) Bioinformatics III
Co-regulation at branch points To examine more systematically whether coregulation enhances the linearity of metabolic flow, analyze the coregulation of enzymes at metabolic branch-points. Search KEGG for metabolic compounds that are involved in exactly 3 reactions. Only consider reactions that exist in S.cerevisae. 3-junctions can integrate metabolic flow (convergent junction) or allow the flow to diverge in 2 directions (divergent junction). In the cases where several reactions are catalyzed by the same enzymes, choose one representative so that all junctions considered are composed of precisely 3 reactions catalyzed by distinct enzymes. Each 3-junction is categorized according to the correlation pattern found between enzymes catalyzing its branches. Correlation coefficients > 0.25 are considered significant. Ihmels, Levy, Barkai, Nat. Biotech 22, 86 (2004) Bioinformatics III
Coregulation pattern in three-point junctions All junctions corresponding to metabolites that participate in exactly 3 reactions (according to KEGG) were identified and the correlations between the genes associated with each such junction were calculated. The junctions were grouped according to the directionality of the reactions, as shown. Divergent junctions, which allow the flow of metabolites in two alternative directions, predominantly show a linear coregulation pattern, where one of the emanating reaction is correlated with the incoming reaction (linear regulatory pattern) or the two alternative outgoing reactions are correlated in a context-dependent manner with a distinct isozyme catalyzing the incoming reaction (linear switch). By contrast, the linear regulatory pattern is significantly less abundant in convergent junctions, where the outgoing flow follows a unique direction, and in conflicting junctions that do not support metabolic flow. Most of the reversible junctions comply with linear regulatory patterns. Indeed, similar to divergent junctions, reversible junctions allow metabolites to flow in two alternative directions. Reactions were counted as coexpressed if at least two of the associated genes were significantly correlated (correlation coefficient >0.25). As a random control, we randomized the identity of all metabolic genes and repeated the analysis. In the majority of divergent junctions, only one of the emanating branches is significantly coregulated with the incoming reaction that synthesizes the metabolite. Ihmels, Levy, Barkai, Nat. Biotech 22, 86 (2004) Bioinformatics III
Co-regulation at branch points: conclusions The observed co-regulation patterns correspond to a linear metabolic flow, whose directionality can be switched in a condition-specific manner. When analyzing junctions that allow metabolic flow in a larger number of directions, there also only a few important branches are coregulated with the incoming branch. Therefore: transcription regulation is used to enhance the linearity of metabolic flow, by biasing the flow toward only a few of the possible routes. Ihmels, Levy, Barkai, Nat. Biotech 22, 86 (2004) Bioinformatics III
Connectivity of metabolites The connectivity of a given metabolite is defined as the number of reactions connecting it to other metabolites. Shown are the distributions of connectivity between metabolites in an unrestricted network () and in a network where only correlated reactions are considered (). In accordance with previous results (Jeong et al. 2000) , the connectivity distribution between metabolites follows a power law (log-log plot). In contrast, when coexpression is used as a criterion to distinguish functional links, the connectivity distribution becomes exponential (log-linear plot). Ihmels, Levy, Barkai, Nat. Biotech 22, 86 (2004) Bioinformatics III
Differential regulation of isozymes Observe that isozymes at junction points are often preferentially coexpressed with alternative reactions. investigate their role in the metabolic network more systematically. Two possible functions of isozymes associated with the same metabolic reaction. An isozyme pair could provide redundancy which may be needed for buffering genetic mutations or for amplifying metabolite production. Redundant isozymes are expected to be coregulated. Alternatively, distinct isozymes could be dedicated to separatebiochemical pathways using the associated reaction. Such isozymes are expected to be differentially expressed with the two alternative processes. Ihmels, Levy, Barkai, Nat. Biotech 22, 86 (2004) Bioinformatics III
Differential regulation of isozymes in central metabolic PW Arrows represent metabolic pathways composed of a sequence of enzymes. Coregulation is indicated with the same color (e.g., the isozyme represented by the green arrow is coregulated with the metabolic pathway represented by the green arrow). Most members of isozyme pairs are separately coregulated with alternative processes. Ihmels, Levy, Barkai, Nat. Biotech 22, 86 (2004) Bioinformatics III
Differential regulation of isozymes Regulatory pattern of all gene pairs associated with a common metabolic reaction (according to KEGG). All such pairs were classified into several classes: (1) parallel, where each gene is correlated with a distinct connected reaction (a reaction that shares a metabolite with the reaction catalyzed by the respective gene pair); (2) selective, where only one of the enzymes shows a significant correlation with a connected reaction; and (3) converging, where both enzymes were correlated with the same reaction. Correlations coefficients >0.25 were considered significant. To be counted as parallel, rather than converging, we demanded that the correlation with the alternative reaction be <80% of the correlation with the preferred reaction. Ihmels, Levy, Barkai, Nat. Biotech 22, 86 (2004) Bioinformatics III
Differential regulation of isozymes: interpretation The primary role of isozyme multiplicity is to allow for differential regulation of reactions that are shared by separated processes. Dedicating a specific enzyme to each pathway may offer a way of independently controlling the associated reaction in response to pathway-specific requirements, at both the transcriptional and the post-transcriptional levels. Ihmels, Levy, Barkai, Nat. Biotech 22, 86 (2004) Bioinformatics III
Genes coexpressed with metabolic pathways Identify the coregulated subparts of each metabolic pathway and identify relevant experimental conditions that induce or repress the expression of the pathway genes. Also associate additional genes showing similar expression profiles with each pathway using the signature algorithm. Input: set of genes, some of which are expected to be coregulated. Output: coregulated part of the input and additional coregulated genes together with the set of conditions where the coregulation is realized. Numerous genes were found that are not directly involved in enzymatic steps: - transporters - transcription factors Ihmels, Levy, Barkai, Nat. Biotech 22, 86 (2004) Bioinformatics III
Co-expression of transporters Transporter genes are co-expressed with the relevant metabolic pathways providing the pathways with its metabolites. Co-expression is marked in green. Ihmels, Levy, Barkai, Nat. Biotech 22, 86 (2004) Bioinformatics III
Co-regulation of transcription factors Transcription factors are often co-regulated with their regulated pathways. Shown here are transcription factors which were found to be co-regulated in the analysis. Co-regulation is shown by color-coding such that the transcription factor and the associated pathways are of the same color. Ihmels, Levy, Barkai, Nat. Biotech 22, 86 (2004) Bioinformatics III
Hierarchical modularity in the metabolic network Sofar: co-expression analysis revealed a strong tendency toward coordinated regulation of genes involved in individual metabolic pathways. Does transcription regulation also define a higher-order metabolic organization, by coordinated expression of distinct metabolic pathways? Based on observation that feeder pathways (which synthesize metabolites) are frequently coexpressed with pathways using the synthesized metabolites. Ihmels, Levy, Barkai, Nat. Biotech 22, 86 (2004) Bioinformatics III
Feeder-pathways/enzymes Feeder pathways or genes co-expressed with the pathways they fuel. The feeder pathways (light blue) provide the main pathway (dark blue) with metabolites in order to assist the main pathway, indicating that co-expression extends beyond the level of individual pathways. These results can be interpreted in the following way: the organism will produce those enzymes that are needed. Ihmels, Levy, Barkai, Nat. Biotech 22, 86 (2004) Bioinformatics III
Hierarchical modularity in the metabolic network Derive hierarchy by applying an iterative signature algorithm to the metabolic pathways, and decreasing the resolution parameter (coregulation stringency) in small steps. Each box contains a group of coregulated genes (transcription module). Strongly associated genes (left) can be associated with a specific function, whereas moderately correlated modules (right) are larger and their function is less coherent. The merging of 2 branches indicates that the associated modules are induced by similar conditions. All pathways converge to one of 3 low-resolution modules: amino acid biosynthesis, protein synthesis, and stress. Ihmels, Levy, Barkai, Nat. Biotech 22, 86 (2004) Bioinformatics III
Hierarchical modularity in the metabolic network Although amino acids serve as building blocks for proteins, the expression of genes mediating these 2 processes is clearly uncoupled! This may reflect the association of rapid cell growth (which triggers enhanced protein synthesis) with rich growth conditions, where amino acids are readily available and do not need to be synthesized. Amino acid biosynthesis genes are only required when external amino acids are scarce. In support of this view, a group of amino acid transporters converged to the protein synthesis module, together with other pathways required for rapid cell growth (glucose fermentation, nucleotide synthesis and fatty acid synthesis). Ihmels, Levy, Barkai, Nat. Biotech 22, 86 (2004) Bioinformatics III
Global network properties Jeong et al. showed that the structural connectivity between metabolites imposes a hierarchical organization of the metabolic network. That analysis was based on connectivity between substrates, considering all potential connections. Here, analysis is based on coexpression of enzymes. In both approaches, related metabolic pathways were clustered together! There are, however, some differences in the particular groupings (not discussed here), and importantly, when including expression data the connectivity pattern of metabolites changes from a power-law dependence to an exponential one corresponding to a network structure with a defined scale of connectivity. This reflects the reduction in the complexity of the network. Ihmels, Levy, Barkai, Nat. Biotech 22, 86 (2004) Bioinformatics III
Summary • Transcription regulation is prominently involved in shaping the metabolic network of S. cerevisae. • Transcription leads the metabolic flow toward linearity. • Individual isozymes are often separately coregulated with distinct processes, providing a means of reducing crosstalk between pathways using a common reaction. • Transcription regulation entails a higher-order structure of the metabolic network. • It exists a hierarchical organization of metabolic pathways into groups of decreasing expression coherence. Ihmels, Levy, Barkai, Nat. Biotech 22, 86 (2004) Bioinformatics III