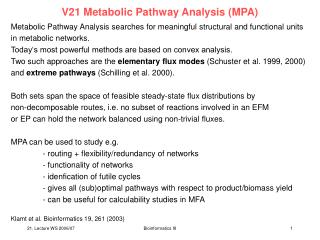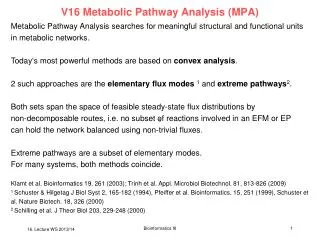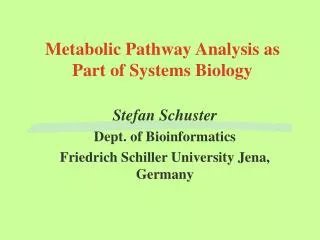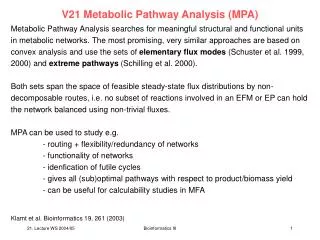
Metabolic pathway analysis
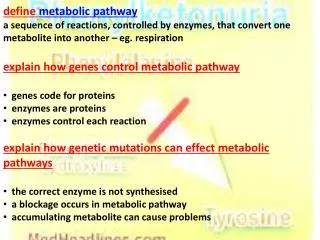
Bioinformatics. Metabolic pathway analysis. Graph-based analysis of biochemical networks. Examples of metabolic pathways. Aspartate biosynthesis. L-Aspartate. ATP. Aspartate kinase. HOM3. 2.7.2.4. ADP. L-aspartyl-4-P. NADPH. Aspartate semialdehyde deshydrogenase. HOM2. 1.2.1.11.

Metabolic pathway analysis
E N D
Presentation Transcript
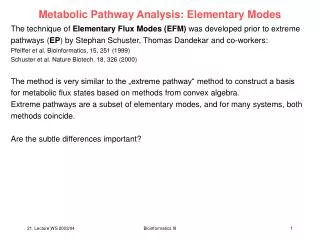
Bioinformatics Metabolic pathway analysis Jacques van Heldenjvanheld@ucmb.ulb.ac.be
Graph-based analysis of biochemical networks Examples of metabolic pathways Jacques van Heldenjvanheld@ucmb.ulb.ac.be
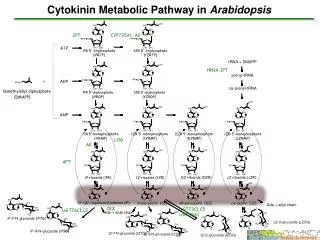
Aspartate biosynthesis L-Aspartate ATP Aspartate kinase HOM3 2.7.2.4 ADP L-aspartyl-4-P NADPH Aspartate semialdehyde deshydrogenase HOM2 1.2.1.11 NADP+; Pi L-aspartic semialdehyde NADPH Homoserine deshydrogenase HOM6 1.1.1.3 NADP+ Threonine biosynthesis MET31 MET32 Met31pmet32p L-Homoserine AcetlyCoA Homoserine O-acetyltransferase MET2 2.3.1.31 CoA O-acetyl-homoserine Sulfur assimilation Sulfide O-acetylhomoserine (thiol)-lyase MET17 4.2.99.10 MET28 Homocysteine Cbf1p/Met4p/Met28p complex CBF1 Cysteine biosynthesis MET4 5-methyltetrahydropteroyltri-L-glutamate Methionine synthase (vit B12-independent) GCN4 Gcn4p MET6 2.1.1.14 5-tetrahydropteroyltri-L-glutamate L-Methionine MET30 Met30p S-adenosyl-methionine synthetase I SAM1 H20; ATP 2.5.1.6 S-adenosyl-methionine synthetase II Pi, PPi SAM2 S-Adenosyl-L-Methionine Methionine Biosynthesis in S.cerevisiae
Aspartate biosynthesis L-Aspartate aspartate kinase II/homoserine dehydrogenase II ATP metL 2.7.2.4 ADP L-aspartyl-4-P Aspartate semialdehyde deshydrogenase NADPH asd 1.2.1.11 NADP+; Pi Lysine biosynthesis L-aspartic semialdehyde NADPH 1.1.1.3 NADP+ Threonine biosynthesis L-Homoserine SuccinylSCoA Homoserine O-succinyltransferase Methioninerepressor metJ metA 2.3.1.46 HSCoA Alpha-succinyl-L-Homoserine Cysteine biosynthesis L-Cysteine Cystathionine-gamma-synthase metB 4.2.99.9 Succinate Cystathionine H2O Cystathionine-beta-lyase metC 4.4.1.8 Pyruvate; NH4+ Homocysteine Cobalamin-independent-homocysteine transmethylase metE 5-MethylTHF 2.1.1.142.1.1.13 metR metR Cobalamin-dependent-homocysteine transmethylase THF metH L-Methionine ATP; H2O 2.5.1.6 Pi; PPi S-Adenosyl-L-Methionine Methionine Biosynthesis in E.coli
L-Aspartate 2.7.2.4 S.cerevisiae E.coli L-aspartyl-4-P 1.2.1.11 L-aspartic semialdehyde 1.1.1.3 L-Homoserine 2.3.1.31 2.3.1.46 Alpha-succinyl-L-Homoserine O-acetyl-homoserine 4.2.99.9 Cystathionine 4.2.99.10 4.4.1.8 Homocysteine 2.1.1.14 L-Methionine 2.5.1.6 S-Adenosyl-L-Methionine Alternative methionine pathways
Aspartate biosynthesis L-Aspartate ATP aspartate kinase III metL 2.7.2.4 ADP L-aspartyl-4-P NADPH; H+ aspartate semialdehyde deshydrogenase asd Methionine biosynthesis 1.2.1.11 NADP+; Pi L-aspartic semialdehyde Threnonine biosynthesis pyruvate dihydrodipicolinate synthase dapA 4.2.1.52 2 H2O dihydropicolinic acid NADPH or NADH; H+ dihydrodipicolinate reductase dapB 1.3.1.26 NADP+ or NAD+ tetrahydrodipicolinate succinyl CoA tetrahydrodipicolinae N-succinyltransferase dapD 2.3.1.117 CoA N-succinyl-epsilon-keto-L-alpha-aminopimelic acid glutamate succinyl diaminopimelateaminotransferase dapC 2.6.1.17 alpha-ketoglutarate succinyl diaminopimelate H2O N-succinyldiaminopimelatedesuccinylase dapE 3.5.1.18 succinate LL-diaminopimelic acid diaminopimelateepimerase dapF 5.1.1.7 meso-diaminopimelic acid diaminopimelatedecarboxylase lysRprotein lysR lysA 3.5.1.18 CO2 L-lysine Lysine biosynthesis in Escherichia coli
LYS5 LYS2 Lysine biosynthesis in Saccharomyces cerevisiae 2-Oxoglutarate Acetyl-CoA homocitrate synthase LYS20 4.1.3.21 CoA 1,2,4-Tricarboxylate homocitrate dehydratase LYS7 But-1-ene-1,2,4-tricarboxylate H2O homoaconitate hydratase LYS4 4.2.1.36 Homoisocitrate NAD+ 1.1.1.87 H+; NADH Oxaloglutarate Homoisocitrate dehydrogenase 1.1.1.87 CO2 2-Oxoadipate L-Glutamate aminoadipate aminotransferase 2.6.1.39 2-Oxoglutarate L-2-Aminoadipate H+ ; NADH (or NADPH) amlnoadipate semialdehyde dehydrogenase 1.2.1.31 NAD+( or NADP+); H2O L-2-Aminoadipate 6-semialdehyde L-Glutamate ; NADPH (or NADH); H+ saccharopine dehydrogenase (glutamate forming) LYS9 1.5.1.10 NADP+ (OR NAD+); H2O N6-(L-1,3-Dicarboxypropyl)-L-lysine NADP+ (OR NAD+) ; H2O saccharopine dehydrogenase (lysine forming) LYS1 1.5.1.7 2-Oxoglutarate ; NADPH (OR NADH) ; H+ L-lysine
KEGG example : proline and arginine metabolism (E.coli) • where is proline ? • how is proline synthesized in E.coli ? • how is proline catabolized in E.coli ? • is it obvious that reactions 1.5.99.8 and 1.5.1.2 have distinct side reactants ?
Graph-based analysis of biochemical networks Pathway reconstruction by reaction clustering Jacques van Heldenjvanheld@ucmb.ulb.ac.be
A graph of compounds and reactions Reactions from KEGG • Compound nodes • 10,166 compounds(only 4302 used by one reaction) • Reaction nodes • 5,283 reactions • Arcs • 10,685 substrate reaction (7,297 non-trivial) • 10,621 reaction product(6,828 non-trivial)
Escherichia coli 4219 Genes (Blattner) 967 enzymes (Swissprot) 159 pathways (EcoCyc) Metabolic Pathways as subgraphs
Reconstructing a pathway from a subset of reactions • Input: • a set of reactions (the seed reactions) • Output: • a metabolic pathway including • the seed reactions, together with their substrates and products • optionally, some additional reactions, interaalated to improve the pathway connectivity • the pathway can either be connected, or contain several unconnected components
Seed nodes Compound Reaction Seed Reaction
Linking seed nodes Compound Reaction Seed Reaction Direct link
Compound Reaction Seed Reaction Direct link Intercalated reaction Enhance linking by intercalating reactions
Validation of the method • Take a set of experimentally characterized pathways, and for each one • Select a subset of enzymes • Use the reactions catalysed by these enzymes as seed nodes • Extract the subgraph • Compare with known pathway
Lysine biosynthesis in E.coli Aspartate biosynthesis L-Aspartate ATP aspartate kinase III lysC 2.7.2.4 ADP L-aspartyl-4-P NADPH; H+ aspartate semialdehyde deshydrogenase asd Methionine biosynthesis 1.2.1.11 NADP+; Pi L-aspartic semialdehyde Threnonine biosynthesis pyruvate dihydrodipicolinate synthase dapA 4.2.1.52 2 H2O dihydropicolinic acid NADPH or NADH; H+ dihydrodipicolinate reductase dapB 1.3.1.26 NADP+ or NAD+ tetrahydrodipicolinate succinyl CoA tetrahydrodipicolinae N-succinyltransferase dapD 2.3.1.117 CoA N-succinyl-epsilon-keto-L-alpha-aminopimelic acid glutamate succinyl diaminopimelateaminotransferase dapC 2.6.1.17 alpha-ketoglutarate succinyl diaminopimelate H2O N-succinyldiaminopimelatedesuccinylase dapE 3.5.1.18 succinate LL-diaminopimelic acid diaminopimelateepimerase dapF 5.1.1.7 meso-diaminopimelic acid diaminopimelatedecarboxylase lysRprotein lysR lysA 3.5.1.18 CO2 L-lysine
Example: reconstitution of lysine pathway • Gap size: 0 • all Ecs from original pathway are provided as seeds • Seeds • 1.2.1.11 • 1.3.1.26 • 2.3.1.117 • 2.6.1.17 • 2.7.2.4 • 3.5.1.18 • 4.1.1.20 • 4.2.1.52 • 5.1.1.7 • Result: • Inferring reaction orientation(reverse or forward) • Ordering
Example: reconstitution of lysine pathway • Gap size: 1 • 5 seed reactions • Result • Inferring missing steps • Inferring reaction orientation • Ordering
Example: reconstitution of lysine pathway • Gap size: 2 • 4 seed reactions • Result • E.coli pathway found • Alternative pathways also returned
Example: reconstitution of lysine pathway • Gap size: 3 • 3 seed reactions • Result • E.coli pathway is not found, because the program finds shortcuts between the seed reactions
Applications of pathway reconstruction • We have the complete genome for dozens of bacteria, for which there is almost no experimental characterization of metabolism • For these genomes, enzymes have been predicted by sequence similarity • In some cases, one expects to find the same pathways as in model organisms, but in other cases, variants or completely distinct pathways • For each known pathway from model organisms • Select the subset of reactions for which an enzyme exists in the target organism • If a reasonable number of reactions are present • Using these as seeds, reconstruct a pathway • Preferentially (but not exclusively) intercalate reactions for which an enzyme has been detected in the target organism
Graph-based analysis of biochemical networks From gene expression data to pathways Jacques van Heldenjvanheld@ucmb.ulb.ac.be
Reaction clustering and gene expression data • Many biochemical pathways are co-regulated at the transcriptional level. • Starting from the observation that a group of genes is co-regulated, try to find if they could be involved in a common pathway.
Alpha cdc15 cdc28 Elu MCM CLB2 SIC1 MAT CLN2 Y' MET Gene expression data: cell cycle Spellman et al. (1998). Mol Biol Cell9(12), 3273-97. Gilbert et al. (2000). Trends Biotech.18(Dec), 487-495.
gene 1 protein 1 expr react 1 cat 1 gene 2 protein 2 expr react 2 cat 2 gene 3 protein 3 expr cat 3 react 3 gene 4 protein 4 expr cat 4 gene 5 protein 5 expr cat 5 react 4 gene 6 protein 6 expr cat 6 gene 7 protein 7 expr gene 8 protein 8 expr gene 9 protein 9 expr Pathway reconstruction Classification gene expressionprofiles Putative pathway cluster of co-regulated genes Building pathways from gene clusters
Sulfate Sulfate adenylyltransferase ATP MET3 2.7.7.4 PPi Adenylyl sulfate (APS) Adenylyl sulfatekinase ATP MET14 2.7.1.25 ADP 3'-phosphoadenylylsulfate (PAPS) 3'-phosphoadenylylsulfatereductase NADPH MET16 1.8.99.4 NADP+; AMP; 3'-phosphate (PAP); H+ sulfite Putative Sulfite reductase MET5 3 NADPH; 5H+ 1.8.1.2 3 NADP+; 3 H2O Sulfite reductase (NADPH) MET10 sulfide O-acetyl-homoserine O-acetylhomoserine (thiol)-lyase MET17 4.2.99.10 Homocysteine 5-methyltetrahydropteroyltri-L-glutamate Methionine synthase (vit B12-independent) MET6 2.1.1.14 5-tetrahydropteroyltri-L-glutamate L-Methionine Pathway found in Spellman’s “MET” cluster
Analysis of Gene Expression Data Gene cluster 20 genes Identify genes coding for enzymes 7 enzymes Identify subset of catalyzed reactions 8 reactions Interconnect these reactions tofind all possible pathways Compare with Classical Pathways Automatic Graph Layout PathwayDiagram Known Pathways 2 matching pathways
Sulfate (extracellular) Sulfate transporter SUL1 Sulfate transport Sulfate transporter SUL2 Sulfate (intracellular) ATP Sulfate adenylyltransferase MET3 2.7.7.4 PPi MET31MET32 Met31p Met32p Adenylyl sulfate (APS) ATP Adenylyl sulfatekinase MET14 2.7.1.25 ADP 3'-phosphoadenylylsulfate (PAPS) NADPH 3'-phosphoadenylylsulfatereductase MET16 1.8.99.4 MET28 NADP+; AMP; H+; 3'-phosphate (PAP) CBF1 Cbf1p/Met4p/Met28p complex sulfite MET4 Putative Sulfite reductase MET5 3 NADPH; 5H+ 1.8.1.2 GCN4 Gcn4p 3 NADP+; 3 H2O Sulfite reductase (NADPH) MET10 sulfide Methionine biosynthesis MET30 Met31p Comparison with Sulfur assimilation
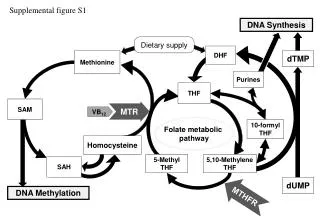
Aspartate biosynthesis L-Aspartate ATP Aspartate kinase HOM3 2.7.2.4 ADP L-aspartyl-4-P NADPH Aspartate semialdehyde deshydrogenase HOM2 1.2.1.11 NADP+; Pi L-aspartic semialdehyde NADPH Homoserine deshydrogenase HOM6 1.1.1.3 NADP+ Threonine biosynthesis MET31 MET32 Met31pmet32p L-Homoserine AcetlyCoA Homoserine O-acetyltransferase MET2 2.3.1.31 CoA O-acetyl-homoserine Sulfur assimilation O-acetylhomoserine (thiol)-lyase Sulfide MET17 4.2.99.10 MET28 Homocysteine Cbf1p/Met4p/Met28p complex CBF1 Cysteine biosynthesis MET4 5-methyltetrahydropteroyltri-L-glutamate Methionine synthase (vit B12-independent) GCN4 Gcn4p MET6 2.1.1.14 5-tetrahydropteroyltri-L-glutamate L-Methionine MET30 Met30p S-adenosyl-methionine synthetase I SAM1 H20; ATP 2.5.1.6 S-adenosyl-methionine synthetase II Pi, PPi SAM2 S-Adenosyl-L-Methionine Comparison with methionine biosynthesis
Summary • Starting from an unordered cluster of genes, one gets an ordered set of reactions, connected to form a pathway • Should permit discovery of novel pathways, that are not stored in any pathway database yet • Interpretation of intercalated reactions • enzyme is not regulated • DNA chip defect for that gene • gene was not on the DNA chip • enzyme remains to be identified in that organism
Analysis of data from Gasch et al. • Gasch et al (2000). Molecular Biology of the Cell, 11:4241-4257 • 6152 yeast genes • Various conditions of stress (heat shock, osmotic shock, peroxide, amino acid starvation, nitrogen depletion • Steady-state growth on alternative carbon sources • Overexpression studies
MSN2 overexpression MSN4 overexpression YAP1 overexpression ethanol galactose glucose mannose raffinose sucrose ethanol vs reference fructose vs reference galactose vs reference glucose vs reference mannose vs reference raffinose vs reference sucrose vs reference Selected experiments
Repressed by mannose (at least 3-fold) Galactose utilization Citrate cycle with shunt (redundancy in the database ?) inferred gluconeogenesis Remark: arrows should be displayed as bi-directional
Repressed by mannose (at least 2-fold) (redundancy in the database ?) Citrate cycle with shunt Galactose utilization gluconeogenesis gluconeogenesis Remark: arrows should be displayed as bi-directional
Induced by galactose (at least 2-fold) Galactose utilization Remark: arrows should be displayed as bi-directional
Repressed by glucose (at least 2-fold) (redundancy in the database ?) Galactose utilization gluconeogenesis gluconeogenesis