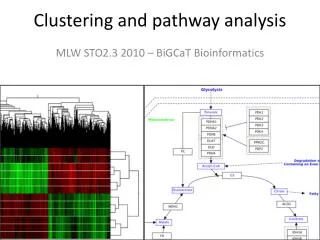
Pathway Analysis
Pathway Analysis. Daniel Hurley. A popular buzzword… but what does it mean?. How do you do it?. How do you interpret the results?. First. What we mean by ‘pathway analysis’. A ‘pathway’ implies causation, but don’t be fooled!. What we mean by ‘pathway analysis’.

Pathway Analysis
E N D
Presentation Transcript
Pathway Analysis Daniel Hurley
A popular buzzword… but what does it mean? How do you do it? How do you interpret the results?
What we mean by ‘pathway analysis’ • A ‘pathway’ implies causation, but don’t be fooled!
What we mean by ‘pathway analysis’ • A ‘pathway’ implies causation, but don’t be fooled! • Most ‘pathway analysis’ actually identifies groups of functionally similar species (transcripts, proteins etc). • Some examples:
What we mean by ‘pathway analysis’ • A useful paper.. But the conclusion is: lots of tools, some quite different approaches!
What we mean by ‘pathway analysis’ • Pathway analysis tools like GATHER, DAVID, and GeneSetDB typically rely on enrichment analyses to tell us things. • This set of techniques asks the question ‘of this set of genes, how many share any particular function, and is that more than we would expect by chance?’ • Example: the top 200 most differentially-expressed transcripts by some ranking (e.g. adjusted p-value) • Other ‘pathway analyses’ involve signatures of groups of transcripts (e.g. using Principal Component Analysis)
What we mean by ‘pathway analysis’ But what do we mean by a ‘function’? Lots of things: Protein function Hypothetical protein function Chromosomal location Metabolic pathway association Disease association Different ‘pathway analyses’ mean very different things!
What we mean by ‘pathway analysis’ • Pathway analysis can identify common features in a group of transcripts/proteins • What the output means depends on the specific biology under study • No such thing really as a ‘general’ pathway analysis • Start by finding papers relevant to the specific biology
What can you do with it? Some answers: • Get a general picture of the active functions in a condition (vs. control) • Identify conditions with similar functions • Investigate whether a particular function is active in a condition • Investigate the functions associated with a particular gene • Differentiate conditions by their active functions
Pathway analysis: how you do it • Begin with a list of transcripts or proteins of interest
Pathway analysis: how you do it • Choose a web-based tool: GATHER and DAVID are good general ones to start But Pathguide.org has 325 pathway links at last count Spend time to find tools which give you results you can interpret
Pathway analysis: how you do it • Enter the list of species: with most tools, you will either paste in names or identifiers, or upload a file
Pathway analysis: interpreting results • Basic tools will produce ranked lists of the most ‘enriched’ categories: GATHER
Pathway analysis: interpreting results • More sophisticated tools will produce ‘network’ diagrams DAVID Ingenuity Pathways Analysis But the interpretation of these is rather subjective
Summary • Pathway analysis should probably be called information enrichment analysis – a more accurate term • Used prudently, it is a useful tool for exploring the functional landscape of an experiment • To make it meaningful, you need to interpret the results in the context of the specific biology under study • There are a lot of web-based tools; start with one which is current and produces a result you value • To present the results, you can use a simple table, or a more complex ‘network’ diagram • Risk: false-positives are very difficult to identify, and with enough data you can link any molecular species to any other species
Fin Any questions?