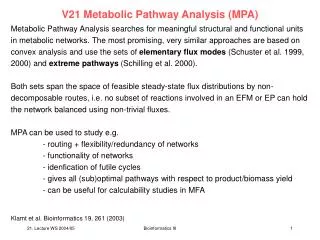
Pathway Analysis
Pathway Analysis. Goals. Characterize biological meaning of joint changes in gene expression Organize expression (or other) changes into meaningful ‘chunks’ (themes) Identify crucial points in process where intervention could make a difference

Pathway Analysis
E N D
Presentation Transcript
Goals • Characterize biological meaning of joint changes in gene expression • Organize expression (or other) changes into meaningful ‘chunks’ (themes) • Identify crucial points in process where intervention could make a difference • Why? Biology is Redundant! Often sets of genes doing related functions are changed
Gene Sets • Gene Ontology • Biological Process • Molecular Function • Cellular Location • Pathway Databases • KEGG • BioCarta • Broad Institute
Other Gene Sets • Transcription factor targets • All the genes regulated by particular TF’s • Protein complex components • Sets of genes whose protein products function together • Ion channel receptors • RNA / DNA Polymerase • Paralogs • Families of genes descended (in eukaryotic times) from a common ancestor
Approaches • Univariate: • Derive summary statistics for each gene independently • Group statistics of genes by gene group • Multivariate: • Analyze covariation of genes in groups across individuals • More adaptable to continuous statistics
Univariate Approaches • Discrete tests: enrichment for groups in gene lists • Select genes differentially expressed at some cutoff • For each gene group cross-tabulate • Test for significance (Hypergeometric or Fisher test) • Continuous tests: from gene scores to group scores • Compare distribution of scores within each group to random selections • GSEA (Gene Set Enrichment Analysis) • PAGE (Parametric Analysis of Gene Expression)
Multivariate Approaches • Classical multivariate methods • Multi-dimensional Scaling • Hotelling’s T2 • Informativeness • Topological score relative to network • Prediction by machine learning tool • e.g. ‘random forest’
Categorical Analysis • Fisher’s Exact Test • Condition on margins fixed • Of all tables with same margins, how many have dependence as or more extreme? • Hard to compute when n or k are large • Approximations • Binomial (when k/n is small) • Chi-square (when expected values > 5 ) • G2 (log-likelihood ratio; compare to c2)
Issues in Assessing Significance • P-value or FDR? • Heuristic only; use FDR • If a child category is significant, how to assess significance of parent category? • Include child category • Consider only genes outside child category • What is appropriate Null Distribution? • Random sets of genes? Or • Random assignments of samples?
Critiques of Discrete Approach • No use of information about size of change • Continuous procedures usually have twice the power of analogous discrete procedures on discretized continuous data • No use of covariation –knowing covariation usually improves power of test
GSEA • Uses Kolmogorov-Smirnov (K-S) test of distribution equality to compare t-scores for selected gene group with all genes
Update Fixes a Problem • Sometimes ranks concentrated in middle • Hack: Ad-hoc weighting by scores emphasizes peaks at extremes
Group Z- or T- Scores • Under Null Hypothesis, each gene’s z-score (zi) is distributed N(0,1) • Hence the sum over genes in a group G: • Identify which groups have highest scores • Same issues as discrete: • Null Distribution: permute which indices? • Hierarchy
Issues for Pathway Methods • How to assess significance? • Null distribution by permutations • Permute genes or samples? • How to handle activators and inhibitors in the same pathway? • Variance Test • Other approaches
The Pathways Proposal • Complex disease ensues from the malfunction of one or a few specific signaling pathways • Alternatives: • Common variants of several genes in the pathway each contribute moderate risk • Rare de novo variants confer great risk and persist for generations in LD with typed markers within unidentified subpopulations of the study group
Approach 1 - Adaptation of GSEA • Order log-odds ratios or linkage p-values for all SNP’s • Map SNP’s to genes, and genes to groups • Use linkage p-values in place of t-scores in GSEA • Compare distribution of log-odds ratios for SNP’s in group to randomly selected SNP’s from the chip
Possible Association Models • Each of several genes may have a variant that confers increased RR independent of other genes • Several genes in contribute additively to the malfunction of the pathway • There are several distinct combinations of gene variants that increase RR but only modest increases in risk for any single variant
Approach 2 – Combining p-values • 1. Compute gene-wise p-value: • Select most likely variant - ‘best’ p-value • Selected minimum p-value is biased downward • Assign ‘gene-wise’ p-value by permutations (Westfall-Young) • Permute samples and compute ‘best’ p-value for each permutation • Compare candidate SNP pvalues to this null distribution of ‘best’ p-values • 2. Combine p-values by Fisher’s method
Methods – 2 • Additive model: • Where ni indexes the number of allele B’s of a SNP in gene i in the gene set G • Select subset of most likely SNP’s • Fit by logistic regression (glm() in R) • Significance by permutations • Permute sample outcomes • Select genes and fit logistic regression again • Assess goodness of fit each time • Compare observed goodness of fit
Key Multivariate Ideas • PCA (Principal Components Analysis) • SVD (Singular Value Decomposition) • MDS (Multi-dimensional Scaling) • Hotelling T2
PCA PCA1 lies along the direction of maximal correlation; PCA 2 at right angles with the next highest variation. Three correlated variables
Multi-Dimensional Scaling • Aim: to represent graphically the most information about relationships among samples with multi-dimensional attributes in 2 (or 3) dimensions • Algorithm: • Transform distances into cross-product matrix • Initial PCA onto 2 (or 3) axes • Deform until better representation • Minimize ‘strain’ measure:
Separating Using MDS Left: distributions of individual variables Right: MDS plot (in this case PCA)
Multivariate Approaches to Selection • Visualizing differences by MDS • Hotelling’s T-squared
MDS for Pathways • BAD pathway Normal IBC Other BC • Clear separation between groups • Variation differences
Hotelling’s T2 • Compute distance between sample means using (common) metric of covariation • Where • Multidimensional analog of t (actually F) statistic
Principles of Kong et al Method • Normal covariation generally acts to preserve homeostasis • The transcription of genes that participate in many processes will be changed • The joint changes in genes will be most distinctive for those genes active in pathways that are working differently
Critiques of Hotelling’s T • Not robust to outliers • Assumes same covariance in each sample • S1 = S2 ? Usually not in disease • Small samples: unreliable S estimates • N < p