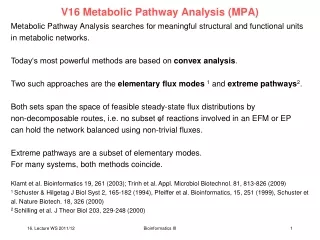
Pathway Analysis
Pathway Analysis. Martina Kutmon. Contents. Background on Pathway Analysis Data Analysis with PathVisio Introduction to the Afternoon Session. Biological Pathways. Why Pathway Analysis?. Intuitive to biologists Puts data in biological context More intuitive way of looking at your data

Pathway Analysis
E N D
Presentation Transcript
Pathway Analysis Martina Kutmon
Contents • Background on Pathway Analysis • Data Analysis with PathVisio • Introduction to the Afternoon Session
Why Pathway Analysis? • Intuitive to biologists • Puts data in biological context • More intuitive way of looking at your data • More efficient than looking up gene-by-gene • Computational analysis • Overrepresentation analysis • Network analysis
Biological Context • Statistical results: • 1,300 genes are significantly regulated after treatment with X • Biological Meaning: • Is a certain biological pathway activated or deactivated? • Which genes in these pathway are significantly changed?
Pathway Collection • Where to get pathways? • Online pathway databases • WikiPathways www.wikipathways.org • Reactome www.reactome.org • Many more ... http://pathguide.org
Identifier Mapping Identifier Mapping Annotation: ENSG00000131828
Identifier Mapping • Microarrays typically use internal ids: • Affymetrix: 205749_at • Agilent: A_14_P106416 • Illumina: ILMN_4380 • Pathways typically use gene/protein ids • Entrez Gene: 1543 • Ensembl: ENSG00000140465 • UniProt: P04637
Identifier Mapping • 2 scenarios • Software will take care of it • e.g. PathVisio uses synonym databases • You will have to convert the ids yourself • DAVID: http://david.abcc.ncifcrf.gov • SOURCE: http://smd.stanford.edu/cgi-bin/source/sourceBatchSearch • BioMART: http://www.biomart.org • NetAffx: http://www.affymetrix.com
Pathway Analysis Tools • PathVisio • BioRAG • MetaCore (GeneGO) • Pathway-Express • GenMAPP / MAPPFinder
PathVisio www.pathvisio.org
Pathway Analysis Workflow Prepare your data Import your data in PathVisio Find „enriched“ pathways Visualize data on pathways Export pathway images
File Format • PathVisio accepts delimited text files • Prepare and export from Excel
File Format • Export from R write.table(myTable, file = txtFile, col.names = NA, sep = "\t", quote = FALSE, na = "NaN")
Identifier Systems PathVisio accepts many identifier systems: • Probes • Affymetrix, Illumina, Agilent,... • Genes and Proteins • Entrez Gene, Ensembl, UniProt, HUGO,... • Metabolites • ChEBI, HMDB, PubChem,...
Gene Database Your data A pathway Entrez Gene 5326 153 4357 65543 2094 90218 … 4357 ?? ENS0002114 P4235
Gene Database • Download from www.pathvisio.org/wiki/PathVisioDownload • 32 species supported
Exception File Exceptions file
Pgex File • Imported data is stored in a .pgex file • Load an existing dataset:
Statistics Unchanged gene Changed gene Question: • Does the small circle have a higher percentage of changed genes than the large circle? • Is this difference significant?
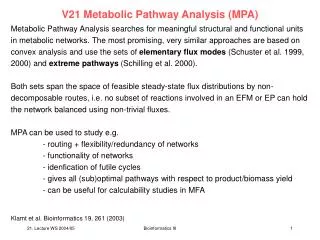
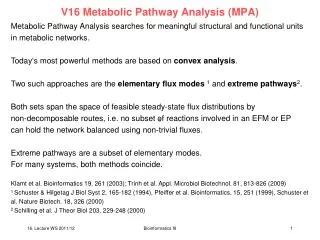
Calculate Z-scores • The Z-score can be used as a measure for how much a subset of genes is different from the rest • r = changed genes in Pathway • n = total genes in Pathway • R = changed genes • N = total genes Other enrichment calculation methods Ackermann M et al., A general modular framework for gene set enrichment analysis, BMC bioinformatics, 2009
Z-score • The Z-score is a ranking method. • High Z-score selection is very different from the rest of the dataset • Z-score = 0 selection is not different at all
Criteria Define criterion and select pathway collection criterion collection
Z-score Calculation r = changed genes in Pathway n = total genes in Pathway r n
Create a Visualization Add/Remove Visualizations Activate visualization options
Visualizations • Gradient based • Fold-change • Rule based • Significant genes
Export Pathway • Export to image formats PNG
PathVisio Team • Maastricht University • Martijn van Iersel • Thomas Kelder • Chris Evelo • Gladstone Institute (San Francisco) • Alexander Pico • Kristina Hanspers • Bruce Conklin • Around the world • Open Source Community
Afternoon Session • Pathway Analysis of liver data set with PathVisio • Find „enriched“ pathways in a WikiPathways analysis collection for rats • Create visualization and set the data in a biological context