Download
1 / 4
40 likes | 127 Vues
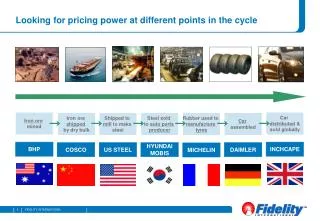
Explore pricing power within the industrial sector cycle through the supply chain, from rubber and iron ore to steel production and car distribution, with a focus on key global companies like Michelin, BHP, and Hyundai. Analyze relative sector positioning, energy weightings, oil prices, and comparative performance against global indices.

E N D
Rubber used to manufacture tyres Iron ore mined Iron ore shipped by dry bulk Shipped to mill to make steel Steel sold to auto parts producer Car assembled Car distributed & sold globally MICHELIN BHP COSCO US STEEL HYUNDAI MOBIS DAIMLER INCHCAPE Looking for pricing power at different points in the cycle
15.0 Dec-09 Mar-10 Jun-10 Sep-10 Dec-10 Mar-11 10.0 5.0 Relative % weighting 0.0 -5.0 -10.0 Industrials Materials Energy Real Estate Utilities Relative Sector Positioning Active management at the sector level Source: FIL Limited, 31.03.2011
Relative Sector Positioning Energy relative weighting (LHS) Oil price (RHS) 12.0 120 10.0 110 8.0 6.0 100 4.0 Fund - Relative % Weighting London Brent Crude Oil Price (US$/Barrel) 2.0 90 0.0 -2.0 80 -4.0 -6.0 70 Dec-09 Mar-10 Jun-10 Sep-10 Dec-10 Mar-11 Source: FIL Limited, 31.03.2011
Comparative performance against global indices Source: Fund data - FIL Limited/Morningstar, Nav to Nav, gross income reinvested, rounded off to one decimal place, all based in USD, as at 30.04.2011. Index data - Datastream, total return, all in USD, as at 30.04.2011. Fund launch – 02.02.2009. FF Global Real Asset Secs outperformed – shaded green, Global Real Asset Secs underperformed – shaded red.