
100
Supplemental figure I. A. B. C. NS. 120. 8. 0.030. 100. NS. NS. 6. NS. 80. 0.020. ##. Relative liver PPAR a mRNA expression. Liver TC (µg/µg prot). Liver weight (%). 60. 4. 0.010. 40. 2. 20. ###. +/+. +/-. -/-. +/+. +/-. -/-. +/+. +/-. -/-. PPAR a. PPAR a.

100
E N D
Presentation Transcript
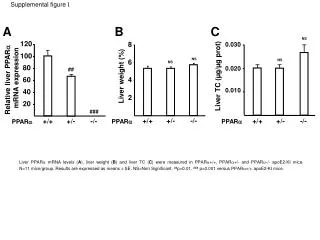
Supplemental figure I A B C NS 120 8 0.030 100 NS NS 6 NS 80 0.020 ## Relative liver PPARa mRNA expression Liver TC (µg/µg prot) Liver weight (%) 60 4 0.010 40 2 20 ### +/+ +/- -/- +/+ +/- -/- +/+ +/- -/- PPARa PPARa PPARa Liver PPARa mRNA levels (A), liver weight (B) and liver TC (C) were measured in PPARa+/+, PPARa+/- and PPARa-/-apoE2-KI mice. N=11 mice/group. Results are expressed as means SE. NS=Non Significant. ##p<0.01, ### p<0.001 versus PPARa+/+ apoE2-KI mice.
Supplemental figure II B A *** *** *** *** 180 180 CON CON 160 160 GW647 GW647 140 140 120 120 ### ### Relative LCAD mRNA expression Relative VLCAD mRNA expression 100 100 80 80 60 60 40 40 20 20 +/+ +/- -/- +/+ +/- -/- PPARa PPARa C D 140 # 140 * * CON CON ## 120 120 GW647 GW647 # 100 100 Relative MCP-1 mRNA expression Relative VCAM-1 mRNA expression 80 80 60 60 40 40 20 20 +/+ +/- -/- +/+ +/- -/- PPARa PPARa Primary hepatocytes were isolated from PPARa+/+, PPARa+/- and PPARa-/-apoE2-KI mice. A-B, Hepatocytes were in vitro treated with GW647 (600 nM) or vehicle (CON, 0.1% Me2SO) for 24h. C-D, Hepatocytes were in vitro treated with GW647 (600 nM) or vehicle (0.1% Me2SO) for 24h and stimulated with LPS (100 ng/mL) for an additional 6-h period. RNAs were extracted and subjected to quantitative RT-PCR analysis to measure VLCAD (A), LCAD (B), MCP-1 (C) and VCAM-1 (D) mRNA levels. *p<0.05, ***p<0.001 versus CON ; #p<0.05, ##p<0.01, ###p<0.001 versus GW647-treated PPARa+/+ apoE2-KI cells


