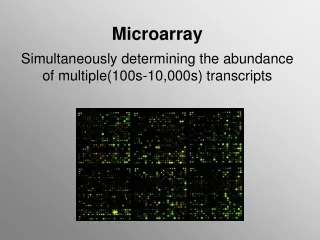
Exploring Microarray Data Patterns for Genetic Disorder Detection
Analyzing microarray data for chromosome 17 markers to identify statistically significant differences among young patients, aiding in genetic disorder diagnosis.

Exploring Microarray Data Patterns for Genetic Disorder Detection
E N D
Presentation Transcript
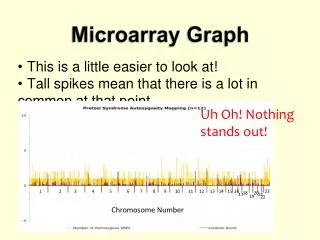
Microarray Graph Uh Oh! Nothing stands out! 1 2 3 4 5 6 7 8 9 10 11 12 13 14 15 16 23 18 20 17 21 19 22 Chromosome Number This is a little easier to look at! Tall spikes mean that there is a lot in common at that point…
Hmm…. Our Data.. Let’s look closely… Can we see if there is a difference among our young patients that is statistically unlikely to happen in the normal population? We can! It’s a Chi-Square statistics test and it allows us to look at our data in a slightly different way…
Chi-Squared Microarray Data What’s this? A big spike at chromosome 17 says something is wrong here! The patients are different from the rest of the population in a way that is statistically significant! 23 21 18 19 1 2 3 4 5 6 7 8 9 10 11 12 13 14 15 16 22 20 17 Chromosome Number
Let’s go back to OMIM… http://www.ncbi.nlm.nih.gov/sites/entrez?db=omim Search terms… macrocephaly AND polyhydramnios AND seizures Looking at our 8 results… which ones have gene problems at chromosome 17…
OMIM SAYS… • POLYHYDRAMNIOS, MEGALENCEPHALY, AND SYMPTOMATIC EPILEPSY; PMSEGene map locus 17q23.3 • It’s our only result on chromosome 17, the area the patients all have a common difference… • So, what IS this poly-whatever? • Let us read….
OMIM Sound about right? Good. We have a diagnosis. Pretzel Syndrome. But that is only ONE GENE! How is this possible?
Diagnosis … Is not easy! Take into account how ALL the systems react and interact. “One goes out, they ALL go out!”