Download
1 / 32
320 likes | 484 Vues
Nonparametric Modeling of Images . Outline Parametric vs. nonparametric Image patches and similarity distance Efros-Leung’s texture synthesis by non-parametric sampling Next week Application into image inpainting Application into image quilting Demos and discussions.

E N D
Nonparametric Modeling of Images • Outline • Parametric vs. nonparametric • Image patches and similarity distance • Efros-Leung’s texture synthesis by non-parametric sampling • Next week • Application into image inpainting • Application into image quilting • Demos and discussions
A Simple Example of Nonparametric Model Class A: blue square, Class B: red triangle
What if we use parametric models? N(m1,C1) N(m2,C2) Difficult for modeling manifold
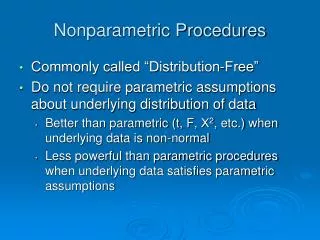
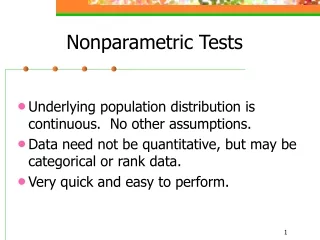
Why Nonparametric? • Nonparametric = “Distribution Free” • E.g., we might assume that X1,X2,…,Xn are independent identically distributed (iid) but we do not know its specific distribution – this is particularly useful for handling data in high-dimensional space • Advantage: the resulting inferential statements are relatively more robust than those from parametric models • Disadvantage: limited application because it is difficult, and often impossible to build into the model more sophisticated structures based on our scientific knowledge (i.e., purely data-driven)
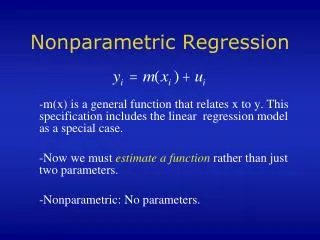
Examples • Regression analysis: predict the stock market value based on the history • Parametric regression: use AR model to fit the observation data • Nonparametric regression: use heuristics – e.g., if the value of stock A increases, then the value of stock B is likely to increase (or decrease) • Texture synthesis: • Parametric: two images will look similar if they have similar first-order/second-order statistics • Nonparametric: two images will look similar if they form similar “clouds” in high-dimensional patch space
Nonparametric Sampling in Natural Language I took a walk in town one day And met a cat along the way. What do you think that cat did say? Meow, Meow, Meow I took a walk in town one day And met a pig along the way. What do you think that pig did say? Oink, Oink, Oink I took a walk in town one day And met a cow along the way. What do you think that cow did say? Moo, Moo, Moo - cited from “Wee Sing for Baby”
Efros-Leung’ Scheme (1999) • Image patches • Look at a group of pixels instead of individual one • Similarity distance • Are two patches visually similar? • Scanning order • Which pixel to synthesize first? • Nonparametric sampling
Image Patches For the convenience of implementation, patches are often taken as square blocks (overlapping is allowed)
Similarity Distance MSE metric Weighted MSE 2D Gaussian kernel
Scanning Order Onion-peel scanning Colored regions denote where synthesis is needed
Putting Things Together 1. Form an inquiry patch ? 2. Find best matched patches 3. Obtain the histogram of center pixels in all matched patches 4. The ? intensity value is given by sampling the empirical distribution
Pseudo-Code Implementation http://graphics.cs.cmu.edu/people/efros/research/NPS/alg.html
Image Examples (Con’d) More examples can be found at http://graphics.cs.cmu.edu/people/efros/research/EfrosLeung.html
Extensions • Similarity metric • Cosine distance = normalized Euclidean distance A B
Extensions (Con’t) B A Sim(A,B) is large but Sim(A,fliplr(B)) is small
Technical Issue: NN search • Nonparametric sampling heavily rely on the search of data points within -ball in the patch space (or NN/kNN search) • Technology before 2000 could not handle such task – conceptually simple but computationally formidable (again due to the curse of dimensionality) • Belong to algorithm complexity and computational geometry
4 6 l1 l9 7 l5 l6 8 l3 l2 5 9 10 3 l10 l8 l7 2 5 4 11 8 2 1 l4 11 1 3 9 10 6 7 Kd-trees* The kd-tree is a powerful data structure that is based on recursively subdividing a set of points with alternating axis-aligned hyperplanes. The classical kd-tree uses O(dnlgn) precomputation time, O(dn) space and answers queries in time logarithmic in n, but exponential in d. l1 l3 l2 l4 l5 l7 l6 l8 l10 l9
4 6 l1 7 8 5 9 10 3 2 1 11 2 5 4 11 8 1 3 9 10 6 7 Kd-trees. Construction l9 l1 l5 l6 l3 l2 l3 l2 l10 l4 l5 l7 l6 l8 l7 l4 l8 l10 l9
l1 q 2 5 4 11 8 1 3 9 10 6 7 Kd-trees. Query 4 6 l9 l1 7 l5 l6 l3 8 l2 l3 l2 5 9 10 3 l10 l4 l5 l7 l6 l8 l7 2 1 l4 11 l8 l10 l9
l1 l3 l2 l4 l5 l7 l6 l8 l10 l9 l1 l2 4 6 l9 7 l5 3 l6 l8 8 l3 l2 5 1 l4 9 10 3 l10 l8 l7 2 1 l4 11 q 2 5 4 11 8 1 3 9 10 6 7 Algorithm Presentation
Scientific issues: Locality Revisited • How do we define local neighborhood? • If the distance between two patches is defined by their photometric similarity, two “close” points in the patch space could be geometrically distant from each other • "Space and time are not conditions in which we live; they are simply modes in which we think.“ – Albert Einstein
A Short Tour of Neuroscience • Despite all the challenges facing image processing and computer vision, human vision system (HVS) provides a concrete example of beating the curse of dimensionality • What is unknown is how HVS did it – i.e., the underlying organizational principle of neurons (best known is so-called Hebbian learning rule)
Photoreceptors rods cones
What do we mean by local? Geometry vs. Topology
Mountcastle’s Discovery The theory posits that the remarkably uniform physical arrangement of cortical tissue reflects a single principle of complexity management which underlies all cortical information processing. Columnar organization of directional neurons