Download
1 / 46
460 likes | 661 Vues
Nonlinear Analysis of Surface ECG Atrial Flutter and Atrial Fibrillation in Man. Tsair Kao Institute of Biomedical Engineering National Yang-Ming University. Atrial Arrhythmias. Typical atrial flutter (T-AFL) Single macro-reentrant wave in atrium

E N D
Nonlinear Analysis of Surface ECG Atrial Flutter and Atrial Fibrillation in Man Tsair Kao Institute of Biomedical Engineering National Yang-Ming University
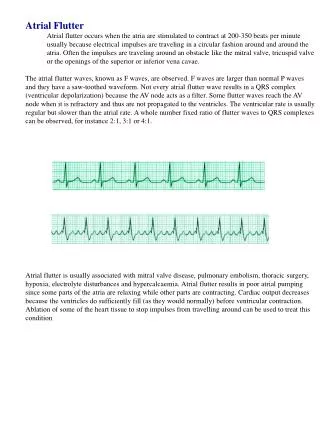
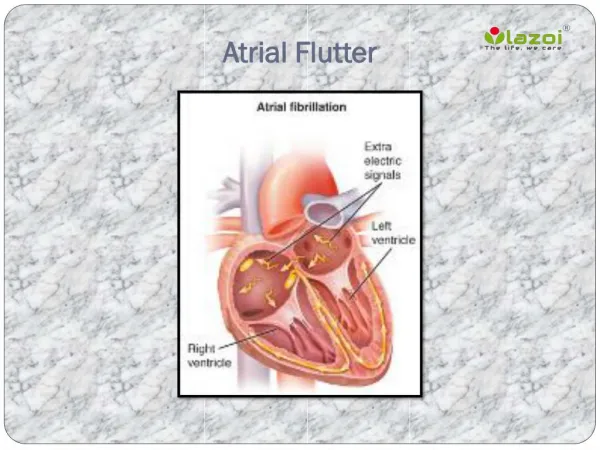
Atrial Arrhythmias Typical atrial flutter (T-AFL) • Single macro-reentrant wave in atrium • Regular conduction to ventricle (2:1, 3:1,6:1) • 240-350 bpm Atypical atrial flutter (A-AFL) • Irregular conduction to ventricle • Often degenerate into atrial fibrillation • 340-430 bpm Atrial fibrillation (Af) • Multiple wavelets in atrium • 300-600 bpm
Atrial Signals Intra-atrial electrogram Epi-cardial electrogram Surface ECG atrial activity Atrial flutter– single reentrant circuit (clockwise and counterclockwise) Atrial fibrillation–simultaneously multi- reentrant circuits
Linear Analysis Time domain • Af/AFL: Ratio between variance and mean of f-wave duration • Normal/ Af: regularity of RR interval • Normal/ arrhythmias: ‘P-wave existing’ and ‘ventricular regularity test’ • Frequency domain • Af/ Sinus and AFL: Magnitude squared coherence • Normal/AFL/Af: ‘dominant frequency’ and spectral
Spectral Analysis Spectral Analysis of Chronic Atrial Fibrillation and Its Relation to Minimal Defibrillation Energy. J Pacing and Clinical Electrophysiology, 25:1747-1751, 2002.
Noncontact and Contact Unipolar Electrograms Electrophysiological Characteristics and Catheter Ablation in Patients with Paroxysmal Right Atrial Fibrillation. Circulation, 112: 1692-1700, 2005.
Frequency Domain Analysis The frequency spectra were plotted and analyzed from 2 to 30 Hz to include only the physiological range of practical interest. The spectra were normalized by the maximum power of the 64 spectra. For each spectrum, the normalized largest peak, which exceeded 0.2, was identified as the dominant frequency (DF). Harmonic index (HI), representing the organization of the AF during the 6.82-second time segment. HI = ( the power of the DF and its harmonic peaks over a 2-Hz window) / (the total power) (from 2 to 30 Hz )
Multi-site Bipolar Recordings and Frequency Analysis Originating from the right superior pulmonary vein (RSPV) Frequency Analysis in Different Types of Paroxysmal Atrial Fibrillation. J Am Coll Cardiol 47:1041-1047, 2006.
Multi-site Bipolar Recordings and Frequency Analysis Paroxysmal AF originating from the SVC
Animal Experiments • Nine canines weighted between 10 and 15 kg. • The 120 electrodes are arranged into 15×8 matrixes. • The recorded signals included:* sinus rhythm* during AF* AF after injection antiarrhythmic drug * before restoration of normal sinus rhythm Open chest sinus rhythm induce AF by electrical stimulation inject Antiarrhythmic drugs restore sinus rhythm
Frequency Coherence Mapping Frequency Coherence Mapping of Canine Atrial Fibrillation: Implication for Anti-arrhythmic Drug-induced Termination Biomed Eng Appl Basis Comm, 13:56-60, 2003.
Isochronal Map in Sinus Rhythm The earliest depolarization area around SA node (dotted square) is denoted as dominant area (DA). Twenty-four electrodes (about 9×15 cm2) are enclosed by the dotted square.
MSC Map Upper 5 maps represent consecutive 10 s of AF signal. Lower 5 maps represent 10 s signal just before AF termination
Independent Component Analysis (ICA) • ICA is a technique for revealing hidden factors that underlie sets of random signals. • Blind Source Separation (BSS): • Solving the “cocktail party problem”
Mutual Information unknown x s A W Independent Component Analysis • s Unknown • Mixing matrix A Unknown • To estimate A and s using only the observed random vector x • Compute W = A-1 • Obtain ICs from s’ = Wx
IC1 X1 IC2 X2 IC3 X3 IC4 X4 IC5 X5 IC6 X6 Noise Reduction Unmixing W Recorded components Independent Components
IC1 IC2 IC3 IC4 IC5 IC6 Preprocessing S’1 S’2 mixing A S’3 S’4 S’5 S’6 0.0017 0.0005 0.7205 0.0006 0.0011 0.1111 0.9878 0.0057 0.1932 0.0007 0.0001 0.0893 0.0046 0.9177 0.0121 0.0016 0.0281 0.1588 0.0019 0.0065 0.0341 0.9966 0.0003 0.0778 0.0039 0.0663 0.0386 0.0002 0.0194 0.4170 0.0002 0.0033 0.0015 0.0003 0.9509 0.1459 Independent Components Reconstruction signals
Original Signals vs. Reconstruction Signals Correlation coefficient S1 S’1 0.639 S2 S’2 0.634 S3 S’3 0.638 S4 S’4 0.002 S5 S’5 0.704 S6 S’6 0.699 Original Signals Reconstruction signals
Mutual Information PCA W S Coherence X Coherence >= 0.5 How Many Components? If the coherence value is greater than 0.5, the ICA process was repeated with a reduced number of output components until the coherence value between each component was smaller than 0.5.
A IVC P I 15 AP 4 Normal Sinus Rhythm
P=procainamide, S=sotalol, NSR=normal sinus rhythm, AF= atrial fibrillation AFBD1,AFBD2: Two AF segments before drug injection AFAD1,AFAD2: Two AF segments after drug injection AFBT: AF just before termination
Independent Component Approach to the Analysis of Epicardial Atrial Electrograms of Electrically Induced Atrial Fibrillation. J Biol Med Eng 25: 93-97, 2005. 中國工程師學會95年工程論文獎
Nonlinear Analysis Nonlinear Analysis of Epicardial Atrial Electrograms of Electrically Induced Atrial Fibrillation in Man I 3 pts II 3 pts 4 sec ECG 1 KHz III 3 pts Hoekstra BPT et al.: J Cardiovasc Electrophysiol, 1995;6:419-440
Nonlinear Analysis Correlation dimension and correlation entropy Discriminate type I, II and III atrial fibrillation Type I not generated by linear stochastic dynamics Correlation dimension and maximal Lyapunov exponent Is heart activity nonlinear dynamics ? • YES • NO
Data Acquisition • Department of Cardiology, Veterans General Hospital, Taipei • Catheter ablation • 12-lead ECG (CardioLab system, Prucka GE) • Sampling frequency: 1kHz • Three types of atrial arrhythmias (10 sec) • Typical atrial flutter • Atypical atrial flutter • Atrial fibrillation
12-lead ECG V1 atrial signal Surrogate test ICA Properties analysis Surface ECG • Null hypothesis: • The input signal is generated from linear stochastic system Remove ventricular activity Adaptive filtering Independent component analysis
Preprocessing ICA Reconstructed signal ( ) X’ Observations (X)
ICA-estimated Atrial Activities II V1 T-AFL A-AFL AF
Comparison • Define the non-QRS region manually • Root-mean squared error
Surrogate Test • N surrogate data Iterative amplitude adjusted Fourier transform (iAAFT) • Time reversibility (trev) Correlation dimension (D2) • Rank order test Reject, accept
Surrogate Test Henon map Xn+1=1-1.4Xn2+0.3Xn Original data Mean =0.2574 SD = 0.7207 Surrogate data Mean =0.2574 SD = 0.7207
Surrogate Test Henon map Xn+1=1-1.4Xn2+0.3Xn Original data Surrogate data max diff: 1.5632×10⁻¹³
Surrogate Test Henon map Xn+1=1-1.4Xn2+0.3Xn Original data Surrogate data
Surrogate Test Time reversibility (trev) Correlation dimension (D2)
Surrogate Test Time reversibility (trev) Correlation dimension (D2)
D2 1 C Typical atrial flutter 2.85 0.61 1.64 1.69 97.89 13.74 Atypical atrial flutter 4.13 0.95 10.48 1.23 125.22 8.26 Atrial fibrillation 5.67 0.62 17.34 2.19 141.17 10.70 Nonlinear Characteristics Differentiation of Atrial Flutter and Atrial Fibrillation from Surface Electrocardiogram Using Nonlinear Analysis J Med Biol Eng, 25(3): 117-122, 2005
Is Fibrillation Chaos? Distinguishing Cardiac Randomness from Chaos