Download
1 / 29
290 likes | 521 Vues
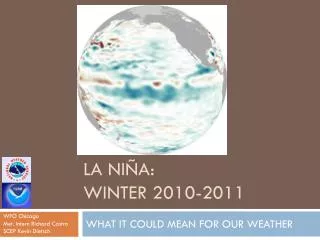
La Niña: winter 2010-2011. WFO Chicago Met. Intern Richard Castro SCEP Kevin Dietsch. WHAT IT COULD MEAN FOR OUR WEATHER. La Niña Advisory: October 7 2010. Issued by the NWS Climate Prediction Center (CPC) La Niña is expected to last at least into the Northern Hemisphere Spring 2011

E N D
La Niña: winter 2010-2011 WFO Chicago Met. Intern Richard Castro SCEP Kevin Dietsch WHAT IT COULD MEAN FOR OUR WEATHER
La Niña Advisory: October 7 2010 • Issued by the NWS Climate Prediction Center (CPC) • La Niña is expected to last at least into the Northern Hemisphere Spring 2011 • This La Niña episode is expected to reach strong criteria during the November-January period, before slowly beginning to weaken
What is La Niña? • Pressure and wind patterns over the tropical Pacific intensify, causing increased upwelling of cool subsurface waters across the eastern and central Pacific • Results in cooler than normal SSTs (negative anomalies) in the eastern and central tropical Pacific • These conditions can persist for months, even up to 2 years or more
What is La Niña? cont’d • Below is an image of the SST anomalies as of 9/29/10, clearly showing the cooler than normal SSTs extending out past the dateline, with warmer than normal waters relegated to near Australia and Indonesia.
La Niña Criteria from CPC • One-month anomaly of -0.5°C or less in the Niño 3.4 region of the equatorial Pacific (5oN-5oS, 120o-170oW) • After 3 consecutive months of these conditions, the Oceanic Niño Index (ONI) threshold is met • La Niña episode becomes official when the negative SST anomaly ONI threshold is met for 5 consecutive overlapping 3-month seasons
Strength of Episodes • Determined from the 3-month average SST anomaly in the Niño 3.4 region at the peak strength of event, which usually occurs between December and April • Weak: -0.5°C - -0.9°C • Moderate: -1.0°C - -1.4°C • Strong: -1.5°C or less
Historical La Niña Episodes since 1949 Lowest ONI Value • ASO 1949 --> FMA 1951 -1.7 • MAM 1954 –-> DJF 1956/57 -2.1 • ASO 1962 --> DJF 1962/63 -0.8 • MAM 1964 –-> DJF 1964/65 -1.1 • NDJ 1967/68 –-> MAM 1968 -0.9 • JJA 1970 –-> DJF 1971/72 -1.3 • AMJ 1973 –-> MAM 1976 -2.0 • SON 1984 –-> ASO 1985 -1.0 • AMJ 1988 –-> AMJ 1989 -1.9 • ASO 1995 –-> FMA 1996 -0.7 • JJA 1998 –-> MJJ 2000 -1.6 • SON 2000 –-> JFM 2001 -0.7 • ASO 2007 –-> AMJ 2008 -1.4
Impacts During Meteorological Winter, December through February • La Niña has global impacts, but here is an image of the important changes that occur during these events in wintertime atmospheric flow patterns and temperatures/precipitation over North America
Impacts During Meteorological Winter, December through February • Details • Highly amplified Polar jet stream allows cold air to build from eastern Alaska to the Northern Plains states of the US • Variable strength Pacific jet stream aimed at the Pacific NW US creates active storm track across the northern US • Warm and dry over the South; warm and wet over the Ohio Valley
What has occurred in the Chicago area? *Average annual snowfall at Chicago-O’Hare is 38.0”
Summary of La Niña Climatology • Slightly warmer on average than 1971-2000 climatological normal • Wetter/snowier than normal • Key point: not overly cold, but cold enough to snow (no top 10 warm winters) • Volatility: Most La Niña winters are warmer, wetter and snowier than normal, but there are exceptions (winter of 1962-1963)
Synoptic Set-up • Below are National Center for Environmental Prediction/National Center for Atmospheric Research (NCEP/NCAR) reanalysis plots of composite 500 and 300 millibar (mb) height anomalies for all twenty La Niña winters combined. cold cold warm warm 300 mb 500 mb
Synoptic Set-up Details • 300 mb plot shows large dip in Polar jet stream over northwestern North America. Corresponding deep 500 mb trough over same region. This allows for the build-up of cold air. • Ridging at 300 and 500 mb to the east owes to highly amplified La Niñapattern and explains the warmth that typically exists over the South and Mid-Atlantic. Think of the Polar jet as being the demarcating line between the very cold air over western Canada and the Northern Plains and warm air that is allowed to flow north from the Gulf of Mexico. • For the Chicago area, being on the western periphery of the ridge, but also near the deep, cold trough, we are susceptible to outbreaks of Arctic air and also periods of unusual warmth, a recipe for significant variability.
Outlook for Winter 2010-2011 • Current La Niña already at moderate strength (Jul-Sept ONI -1.0o C) • CPC is fairly confident based on their modeling that La Niña conditions will intensify enough to reach the strong threshold between November and January, before slowly weakening • http://www.cpc.noaa.gov/products/analysis_monitoring/lanina/enso_evolution-status-fcsts-web.pdf • A look at moderate-strong La Niña episodes to shed some light on what may occur this winter:
Outlook for Winter 2010-2011 cont’d • On average, 2 degrees above normal; over 1” above normal precipitation; greater than 2” above normal snowfall • Higher probability: • Relatively warm (no top 10 cold winters, 9 of 11 above normal); • Above normal precip. (more snow, if cold enough) • What actually occurs will result from the complex interaction between the ongoing La Niña and other atmospheric circulation patterns • It will ultimately come down to whether we receive more frequent visits from Arctic air to our northwest or warm air over the South. • Monitor the buildup of cold over western Canada- could hold the key to how much cold air can get involved in the pattern.
Wildcard: Severe Weather and Tornadoes • Since forecast area is typically on western edge of the ridge over the eastern CONUS, warm, humid air masses occasionally make their way into the region during the winter. • When countered by cold, dry air originating from the trough to our northwest, a significant temperature and moisture contrast results, providing some of the ingredients for severe weather. • With the Pacific jet stream aimed farther north, an active storm track means storm systems are more likely to encounter the above set-up, making severe weather more likely as well
Severe Weather and Tornadoes Statistics • There have been 8 tornadoes in the December-February period over the WFO Chicago County Warning Area (CWA) since 1950 • 4 of these tornadoes occurred during La Niña winters • Here is a list of these 8 tornadoes and their intensities (tornadoes during La Niña winters are highlighted in red)
Severe Weather and Tornadoes Statistics cont’d • 8 events is a small sample size. What if we also include severe wind reports (t-storm winds 58+ mph) and hail (diameter 1” +)? • 40 wintertime t-storm wind cases and 5 severe hail cases since 1950 in the Chicago CWA • 71.1%, or 32 of these events (29 out of 40 wind, 3 out of 5 hail) occurred in La Niña winters! • Including the 8 tornado events, 36 of the 53 total severe reports, or 67.9%, occurred in in La Niña winters. • Appears to be a significant linkage between La Niña conditions and wintertime severe weather in the Chicago area
Wintertime Tornadoes In Depth • Much of the work on the following slides was done by Science Operations Officer Eric Lenning and Summer 2010 Volunteer and current Valparaiso Meteorology student Anthony Lyza
Set-up prior to Boone to McHenry County tornado on January 7, 2008 • Fronts and Pressure • Jan. 7, 2008 ~12z • Chicago-O’Hare reached a record high of 65 degrees that day. • Dewpoints were in the 50s ahead of front. Lenning (2008)
Summary (Lenning 2008) Winter tornadoes are quite rare in the LOT CWA: 1950 had been last January tornado. La Niña associated with increased frequency of winter tornadoes in IL and IN. Similarities between events: La Niña pattern, record warm temperatures, ample moisture, frontal boundary. Winter tornadoes more likely to be strong/severe due to stronger winds aloft and better jet dynamics.
El Niño and La Niña and Phase of the North Atlantic Oscillation (NAO) • Lyza (2010) conducted a larger study of all wintertime severe cases in surrounding CWAs (Milwaukee/Sullivan, Quad Cities, Central Illinois, Indianapolis, and Northern Indiana) along with the Chicago CWA • Aimed to determine whether in addition to La Niña or El Niño conditions, there was a linkage to a particular phase of the NAO that is more conducive to severe weather
La Niña/Positive NAO • 53 months • 4 months featured significant tornadoes (EF-2 +) in the Chicago/Romeoville CWA, with an additional weak tornado event • Overall, 23 months featured severe weather in the study area (43.4% of cases) • Average ONI • Severe: -1.2 • Non-severe: -0.7 • Average NAO • Severe: 0.73 • Non-severe: 0.66 • For Chicago CWA, 22.6% of months featured severe weather
La Niña/Negative NAO • 42 months • 1 weak tornado in the Chicago/Romeoville CWA (February 2006) • Overall, 15 months featured severe weather in the study area (35.7% of all cases) • Average ONI • Severe: -0.7 • Non-severe: -0.7 • Average NAO • Severe: -0.71 • Non-severe: -0.91 • For CWA, 11.9% of months featured severe weather
Conclusions (Lyza 2010) • La Niña/positive NAO conditions are most conducive for wintertime severe weather in or around the Chicago/Romeoville CWA • Within the context of –ONI/+NAO, moderate-strong La Niña conditions provide the greatest number of cases in the study region
Final Point • Knowing that it is highly likely that moderate-strong La Niña conditions will exist throughout the upcoming meteorological winter, it may be worthwhile to track the phase and forecasted phase of the NAO to key on the potential for severe weather in the forecast period