Download
1 / 25
300 likes | 635 Vues
An Introduction to R: Monte Carlo Simulation. MWERA 2012 Emily A. Price, MS Marsha Lewis, MPA Dr . Gordon P. Brooks. Objectives and/or Goals. Three main parts Data generation in R Basic Monte Carlo programming (e.g. loops) Running simulations (e.g., investigating Type I errors).

E N D
An Introduction to R: Monte Carlo Simulation MWERA 2012 Emily A. Price, MS Marsha Lewis, MPA Dr. Gordon P. Brooks
Objectives and/or Goals • Three main parts • Data generation in R • Basic Monte Carlo programming (e.g. loops) • Running simulations (e.g., investigating Type I errors)
Why Use Monte Carlo Methods? • According to Mooney (1997) Monte Carlo simulations are useful to • Make inferences when weak statistical theory exists for an estimator • Test null hypotheses under a variety of plausible conditions • Assess the quality of an inference method • Assess the robustness of parametric inference to assumption violations • Compare estimator’s properties
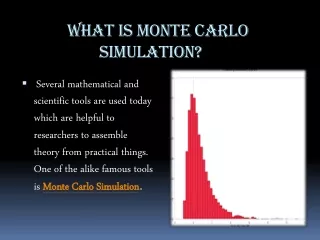
What are Monte Carlo Methods? • Experiments composed of random numbers to evaluate mathematical expressions (Gentle, 2003) • Empirically determine the sampling distribution of a test statistic • Computer-based methods for approximating values and properties of random variables(Braun & Murdoch, 2007)
Logic of Monte Carlo • Mooney (1997) presents five steps • Specify the pseudo-population in symbolic terms in such a way that it can be used to generate samples. That is, writing code to generate data in a specific manner. • Sample from the pseudo-population in ways that reflect the topic of interest • Calculate θin a pseudo-sample and store it in a vector • Repeat steps 2 and 3 t times where t is the number of trials • Construct a relative frequency distribution of resulting values which is a Monte Carlo estimate of the sampling distribution of under the conditions specified by the pseudo-population and the sampling procedures
Practical Issues/ Considerations • What software to use? • How much time to run the simulation? • Reproducibility of results • Adequacy of random number generator
Why use R? • It’s FREE • It is a flexible language that can be controlled by the user • It uses a vector based approach • Depending on the package, there are built in commands which the user can access and minimize the amount of programming required for MC simulation • Make sure to load the require packages at the beginning of the session • R community has a plethora of information: help websites, listservs, textbooks, blogs • Manuals for R available at http://cran.r-project.org/manuals.html
Part 1: Data Generation • RNG and setting seed • Purpose of the seed is to recovery results • Initialize all parameters of interest • Loops • Print results • Access output
Generating a Single Random Variable • R has four parts: CDF, PDF, Quantile function and simulation procedure • dnorm, pnorm, qnorm, rnorm respectively • rnorm(x,mean=0,sd=1) • runif(20,min=2,max=5) • Distributions: normal, uniform, poisson, beta, gamma, chisquare, weibull, exponential
Try it, you’ll like it! • rnorm(x,mean=0,sd=1) Generate a normal distribution of 50 values with a mean of 50 and sd of 10 • x <- sample(1:2,20,TRUE,prob=c(1/2,1/2)) Generate data that mimics rolling a die
Generating Correlated Data • X~Normal (20, 5), Y~Normal (40, 10), corr(X,Y) =0.6 • 4 inputs • Sample size, mean, variance-covariance matrix, and method • 3 methods of data generation • Eigenvalue (default), Singular Value, and Cholesky
Try it, you’ll like it! • rmvnorm(n, mean, sigma, method) Generate data for 3 variables such that X --Normal (20, 5), Y-- Normal (40, 10), Z -- Normal (60,15) and Corr(X,Y) =0.6, Corr(X,Z) = 0.7, Corr(Y,Z)=0.8
Part 2: Basic MC Programming • Four steps (Braun & Murdoch, 2007) • Understand the problem • Work out a general idea how to solve it • Flow charts • Translate your general idea into a detailed implementation • Turn the flowchart into code • Check: Does it work?
Programming Commands* • Loops • for, if, ifelse, while • Statements • repeat, break, next * We can’t cover all programming aspects but wanted to mention other commands
Functions • They are “self-contained units with a well-defined purpose” (Braun & Murdoch, 2007, p. 59) • Take an input, do some calculations, and produce an output • In R, functions are objects and can be manipulated like other more common objects such as vectors, matrices, and lists. • R provides source code for its own functions • R allows you to write your own functions
Part 3: Running Simulations • Trimmed mean sampling distribution • Replicating a published Monte Carlo study in R. • Zimmerman, D. W. (2004). A note on preliminary tests of equality of variances. British Journal of Mathematical and Statistical Psychology 57, 173–181.
Questions • Thank you for your time
References • Braun, W. J., & Murdoch, D. J. (2007). A first course in statistical programming with R. New York: Cambridge University. • Gentle, J. E. (2003). Random number generation and Monte Carlo methods (2nd ed.). New York: Springer-Verlag. • Mooney, C. Z. (1997). Monte Carlo simulation (Sage University Paper series on Quantitative Applications in the Social Sciences, series no. 07-116). Thousand Oaks, CA: Sage. • Zimmerman, D. W. (2004). A note on preliminary tests of equality of variances. British Journal of Mathematical and Statistical Psychology 57, 173–181.