Download
1 / 41
460 likes | 1.2k Vues
High throughput expression analysis using RNA sequencing ( RNAseq ). June 18, 2019. Lecture objectives. Theory and practice of RNA sequencing (RNA- seq ) analysis Rationale for sequencing RNA Challenges specific to RNA- seq Types of libraries for RNA- seq Sequencing coverage (depth)

E N D
High throughput expression analysisusing RNA sequencing (RNAseq) June 18, 2019
Lecture objectives • Theory and practice of RNA sequencing (RNA-seq) analysis • Rationale for sequencing RNA • Challenges specific to RNA-seq • Types of libraries for RNA-seq • Sequencing coverage (depth) • Basic themes of RNA-seq analysis work flows • Terminology for RNA-seq • Steps in RNAseq analysis • Downstream interpretation of expression and differential estimates
RNA sequencing Generate cDNA, fragment, size select, add linkers Isolate RNAs Samples of interest Condition 1 (normal colon) Condition 2 (colon tumor) Sequence ends Map to genome, transcriptome, and predicted exon junctions 100s of millions of paired reads 10s of billions bases of sequence Downstream analysis
Before you start: • What is your experimental question? • Is a global expression experiment the best approach? • What is your experimental model? • Is global expression technically feasible? • How many replicates are needed? • What is your budget? • Minimal 3 replicates/condition to do statistics • Number of replicates depends on biological variability • Cell culture < inbred mice < human tumors Number of replicates needed increases
Common analysis goals of RNA-Seq analysis • Gene expression and differential expression • Alternative expression analysis • Transcript discovery and annotation • Allele specific expression • Relating to SNPs or mutations • Mutation discovery • Fusion detection • RNA editing • miRNA & other non-coding RNA detection/differences
Why sequence RNA (versus DNA)? • Functional studies • Genome may be constant but an experimental condition has a pronounced effect on gene expression • e.g. Drug treated vs. untreated cell line • e.g. Wild type versus knock out mice • Some molecular features can only be observed at the RNA level • Alternative isoforms, fusion transcripts, RNA editing • Predicting all possible transcript sequences from genome sequence is difficult • Alternative splicing, RNA editing, etc.
Why sequence RNA (versus DNA)? • Interpreting mutations that do not have an obvious effect on protein sequence • ‘Regulatory’ mutations that affect what mRNA isoform is expressed and how much • e.g. splice sites, promoters, exonic/intronic splicing motifs, etc. • Prioritizing protein coding somatic mutations (often heterozygous) • If the gene is not expressed, a mutation in that gene would be less interesting • If the gene is expressed but only from the wild type allele, this might suggest loss-of-function (haploinsufficiency) • If the mutant allele itself is expressed, this might suggest a candidate drug target
Challenges • Sample • Purity?, quantity?, quality? • RNAs consist of small exons that may be separated by large introns • Mapping reads to genome is challenging • The relative abundance of RNAs vary wildly • 105 – 107 orders of magnitude • Since RNA sequencing works by random sampling, a small fraction of highly expressed genes may consume the majority of reads • Ribosomal and mitochondrial genes most highly expressed • RNAs come in a wide range of sizes • Small RNAs must be captured separately • PolyA selection of large RNAs may result in 3’ end bias • RNA is fragile compared to DNA (easily degraded)
Challenges, cont. • Experimental model: • Mammalian, eukaryote, bacteria or virus? • Patient derived tissue or cells? • Minimum number biological replicates to achieve statistical significance? • Three biological replicates for cultured cells • Three biological replicates for inbred mice, for each condition • Human samples? • As many as possible, assuming that you can identify reasonable controls
Biological versus technical replicates Technical replicate 1 Library prep & sequencing Library prep & sequencing Technical replicate 2 Library prep & sequencing Biological replicate 1 Library prep & sequencing Biological replicate 2 Biological replicates are preferred (necessary) Technical variation between library preps is not large for experienced technicians
Variability of RNA-seq libraries • The relative log expression should be constant across the libraries • Libraries from different conditions should cluster together Reference: Risso D. et.al. Nature Biotech. (2014) 32:896-902
RNA quality is key to success • Garbage in…garbage out • Amount of RNA influences which type of library you can construct • Quality of the RNA determines if the library construction will work well enough to give you usable data
Purity of RNA • Pure RNA absorbs strongly at 260 nm • Ratio of absorbance 260/280 used to assess purity • Ratio = 2.1 if pure (1.8-2.0 acceptable) • Ratio depends on pH if there are protein contaminants • A260 remains constant, A280 changes if proteins are present • Ratio 260/230 should also be close to 2 • If <2, proteins, guanidinium isothiocyanate or phenol may be contaminants • Always take a scanning measurement (220-300 nm) Reference: http://biomedicalgenomics.org/RNA_quality_control.html
RNA purity, cont. • RNA quality determined using a Agilent Bioanalyzer • Lab on a chip to perform capillary electrophoresis with a fluorescent dye that binds to RNA • Determines RNA concentration & integrity • Works with ng quantities of RNA (50 – 300 ng/ul) • QC determined by 28S/18S ratio
MW of 28S RNA is ~2.5x more than 18S RNA (mammalian) • So a 28S/18S ratio of 2 is considered ideal • Can vary between species
Agilent example / interpretation • RNA quality assessed by Agilent Bioanalyzer • “RIN” = RNA integrity number • 0 (bad) to 10 (good) RIN = 6.0 RIN = 10 RIN values of >7 sufficient for library prep
Enrichment of desired RNA • mRNA makes up 1-3% of total RNA • Ribosomal RNA >80%, with majority of that 18S/28S RNA • polyA selection • Not species specific • Works reasonably well for gene expression analyses • Ribosomal depletion (Ribo-Minus) • Based on oligonucleotide probes that capture rRNA and remove it via binding to streptavadin-coated magnetic beads • Species specific, or at least specific to taxonomic groups • Necessary if interested in non-coding RNA analysis
Other RNA-seq library construction strategies • Size selection (before and/or after cDNA synthesis) • Small RNAs (microRNAs) vs. large RNAs? • Less bias with RNA fragmentation prior to cDNA synthesis • Linear amplification • insertion sites (viral, gene therapy) • Ref: Nature Protocols (2011) 6:1026 • Strand-specific sequencing • Ref: Current Genomics (2013) 14:173 • Exome capture • Cancer Genomes, 1000 genomes, NHLBI genome sequencing • Review on exomevs transcriptome for variant detection • Exp. Rev. Mol. Diag. (2012) 12:241-251
Sequence coverage (depth) needed for RNA-seq • Question being asked of the data • Gene expression? Alternative expression? Mutation calling? • Tissue type • RNA preparation, quality of input RNA, library construction method, etc. • Sequencing type • read length, paired vs. unpaired, etc. • Computational approach and resources • Identify publications with similar goals • Pilot experiment • Work with your Core facility
Sequence coverage (depth) C = LN/G • C = coverage • L = read length • N = number of reads (depends on sequencer; Illumina v3 capacity is 189 million reads /lane) • G = haploid genome length 100 bp reads of human DNA on Illumina (single lane) C = (100 bp)*(189 x 106)/(3 x 109bp) = 6.3 That is, each base will be sequenced between 6 & 7 times SNP discovery requires 10-30X coverage
Sequence coverage, cont. 100 bp reads of human transcriptome (RNA) on Illumina v3 Human transcriptome: 50 million bp C = (100 bp)*(189 x 106)/(50 x 106bp) = 378 • Only need 30X coverage for gene expression analysis • Run 10 RNAseq libraries on a single lane and still get enough coverage for the analysis • Use barcodes that distinguish different libraries for analysis
How many replicates? • Statistical considerations suggest that you need at least 3 biological replicates to make valid comparisons • More complex samples need more replicates to increase the signal above the biological variability • Cost of experiment which is dependent on the depth of sequencing required and thus how many chips (Ion Torrent) or lanes (HiSeq) of sequencing you need • Plan this well in advance in consultation with the core personnel • Do as many replicates as is feasible and affordable
Steps in RNAseq workflow • Obtain raw data from sequencer • Align/assemble reads • Process alignment to quantify reads/gene feature • Conduct differential analysis • Summarize and visualize • Create gene lists, prioritize candidates for validation, etc. • Conduct gene enrichment or pathway analysis
Some nomenclature Sequencing file types: Fasta (sequence only) Fastq (contains quality scores) >SEQ_ID GATTTGGGGTTCAAAGCAGTATCGATCAAATAGTAAATCCATTTGTTCAACTCACAGTTT @SEQ_ID GATTTGGGGTTCAAAGCAGTATCGATCAAATAGTAAATCCATTTGTTCAACTCACAGTTT + !''*((((***+))%%%++)(%%%%).1***-+*''))**55CCF>>>>>>CCCCCCC65
Alignment files • SAM – Sequence Alignment/MAP coordinate file • Tab-delimited ASCII file with all of the information needed for the alignment of the reads to reference HWI-ST155_0544:7:2:7658:34048#0 16 Chr1 2082 1 42M * 0 0 GTAGAGGTAGGACCAACAAGGACCAAGTTTCCCTGTTCCAAC ghghhhhgcghh_hhhhhhhhhhhhhhhhghhhhhghhhhhh NM:i:0 NH:i:4 CC:Z:Chr10 CP:i:1057787 HWI-ST155_0544:7:61:11040:141129#0 0 Chr1 2956 1 42M * 0 0 CTTTTCTGGCGTAACTTGGTTCCCTTTAGTTTGGAACAGATA hhhhhhhhhhhhhhhhhhhhhhhhhhhhhhhhghhchfhhhh NM:i:0 NH:i:3 CC:Z:Chr10 CP:i:1056913 HWI-ST155_0544:7:8:11214:130793#0 0 Chr1 3645 1 42M * 0 0 CAAATAGTGGTTTGAAACCTATCAATCAAGTCACTTTCAAGT gggggggggggggggggeggdffffggggggggggggdggfc NM:i:0 NH:i:3 CC:Z:Chr10 CP:i:1056224 • BAM – Binary version of SAM • Machine readable, smaller more compact version • More commonly used by viewers and analysis programs
Reference guided RNAseq alignment • You have a sequenced genome and a file with the gene model annotations • Genome reference file is usually a fasta file with each chromosome as a separate entry • GTF = gene transcript file • GFF = gene feature file (GFF3) • The GTF/GFF chromosome name must match the chromosome name in the genome reference file CHR Source Type Start Stop Strand Feature Chr_1 CNA3 gene 14025 16421 . - . ID=CNAG_00003; Name=transporter Chr_1 CNA3 mRNA 14025 16421 . - . ID=CNAG_00003T0; Parent=CNAG_0003; Name=transporter Chr_1 CNA3 exon 16002 16421 . - . ID=7000009599314867;Parent=CNAG_00003T0 Chr_1 CNA3 CDS 16002 16370 . - . ID=CNAG_00003T0.cds;Parent=CNAG_00003T0
Gene expression differences • Once you have your data as counts (number of reads/feature), you can use a variety of tools to compare the different conditions and determine what genes are differentially expressed • EdgeR, DESeq2, NOISeq • Employ different statistical models and normalization methods
Multiple testing correction • As more attributes are compared, it becomes more likely that the treatment and control groups will appear to differ on at least one attribute by random chance alone. • Well known from array studies • 10,000s genes • 100,000s exons • With RNA-seq, even greater problem • All the complexity of the transcriptome • Large variety and number of potential features • Genes, transcripts, exons, junctions, retained introns, microRNAs, lncRNAs
Lessons learned from microarray days • Hansen et al. “Sequencing Technology Does Not Eliminate Biological Variability.” Nature Biotechnology 29, no. 7 (2011): 572–573 • You still need to do replicates!! • Minimum of 3 replicates for statistical analysis to be robust
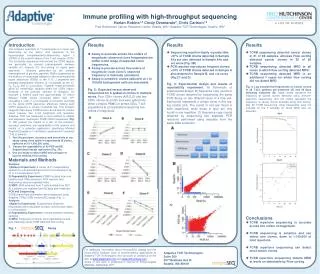
Source of data Carreras-Gonzalez A. et. al. “A multi-omics analysis reveals the regulatory role of CD180 during the response of macrophages to Borrelia burgdorferi” Emerging Microbes and Infections (2018) 7: 1-13 Lyme Borreliosis Ixodesscapularis Borrelia burgdorferi LB most prevalent arthropod-borne infectious disease in N. America Photo Credit: Content Providers(s): CDC - This media comes from the Centers for Disease Control and Prevention's Public Health Image Library (PHIL), with identification number #6631.
Carreras-Gonzalez et. al. approach • Large-scale analytical approach (transcriptomics and proteomics) to identify biomarkers or define the disease stage and improve early detection and diagonosis • Measured global transcriptional profile in murine macrophages and human monocytes after exposure to B. burgdorferi • Proteomics analysis of murine macrophages after stimulation with B. burgdorferi • Genes and proteins identified are mouse or human, not from the bacteria or tick
For Exercise 2 • Gene list: • List of genes showing differential expression in B. burgdorferi stimulated murine macrophages vs unstimulated macrophages. • You will use Excel to do simple transformations of data, sort and cull data and compare lists of genes between Excel worksheets • You will then use db2db program within bioDBnet to input a list of Gene IDs and get back a list of additional database identifiers, such as gene symbols, names and other annotation • Write a narrative of how you generated the final gene list
Why do you need other IDs? • Motivation: • Quick way to find basic information about a list of genes • Some websites for analysis prefer specific identifiers • To compare to a list of genes from a different experiment, may need different identifiers • Find homologs in other species which might be more tractable for experiments
A few comments on the gene list • This list was generated by the program DESeq2, one of the more commonly used RNAseq analysis programs. • By default it generates output with 7 columns
What do you do with this list? • Remove the unnecessary columns: • baseMean, lfcSE, stat and pvalue • Cull the data to look at only the significantly differentially expressed genes • Sort by padj and remove all rows with values >0.01 • Sort by log2FC; delete all rows with values between 1 and -1 • A log2FC of 1 = 2-fold change in expression • The log2FoldChange (log2FC) represents the comparison of B. burgdorferi stimulated/unstimulated murine macrophages
bioDBnet https://biodbnet-abcc.ncifcrf.gov/ https://frederick.cancer.gov/