Comparing Means and Proportions: Statistical Inference in Experimental Research
This article provides a comprehensive guide on comparing two groups using confidence intervals (CI) and significance tests to evaluate means for quantitative variables and proportions for categorical variables. It discusses an experiment involving cell phone use and driving to illustrate the process of analyzing differences in response times. Additionally, it covers essential concepts related to dependent and independent samples, population proportions, and confidence intervals, with real study examples. This analysis aids in understanding how statistical significance can be determined, despite potential practical insignificance.

Comparing Means and Proportions: Statistical Inference in Experimental Research
E N D
Presentation Transcript
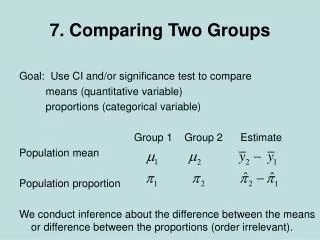
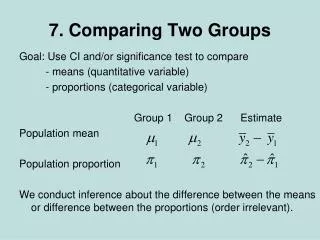
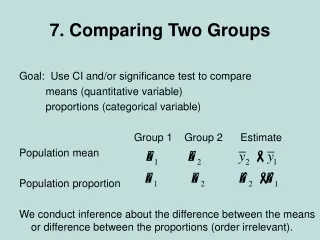
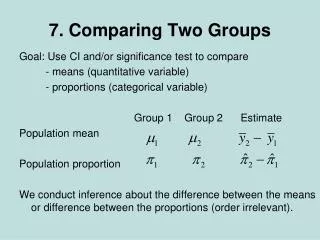
7. Comparing Two Groups Goal: Use CI and/or significance test to compare - means (quantitative variable) - proportions (categorical variable) Group 1 Group 2 Estimate Population mean Population proportion We conduct inference about the difference between the means or difference between the proportions (order irrelevant).
Example: Does cell phone use while driving impair reaction times? • Article in Psych. Science (2001, p. 462) describes an experiment that randomly assigned 64 students to cell phone group or control group (32 each). Driving simulating machine flashed red or green at irregular periods. Instructions: Press brake pedal as soon as possible when detect red light. See http://www.psych.utah.edu/AppliedCognitionLab • Cell phone group: Carried out conversation about a political issue with someone in separate room. • Control group: Listened to radio broadcast
Purpose of study: Analyze whether (conceptual) population mean response time differs significantly for the two groups, and if so, by how much. • Data in millisec. • Cell-phone group: • = 585.2 • s1 = 89.6 • Control group: • = 533.7 • s2 = 65.3.
Types of variables and samples • The outcome variable on which comparisons are made is the response variable. • The variable that defines the groups to be compared is the explanatory variable. • Example: • Reaction time is response variable • Group (cell-phone, control) is explanatory variable • A categorical variable with two categories: (cell-phone, control) • Problem: What are the response and explanatory variables in your projects?
Dependent samples -- natural matching between each subject in one sample and a subject in other sample, such as in “longitudinal studies,” which observe subjects repeatedly over time • Independent samples -- different samples, no matching, as in this example and in “cross-sectional studies” • Problem: • What kind of samples are used in the cell-phone group study? • Give examples of both types of samples in your project?
CI comparing two proportions • Recall se for a sample proportion used in a CI is • se for the difference between two sample proportions for independent samples is • A CI for the difference between population proportions is As usual, z depends on confidence level, 1.96 for 95% confidence
Example: College Alcohol Study conducted by Harvard School of Public Health (http://www.hsph.harvard.edu/cas/) Trends over time in percentage of binge drinking (consumption of 5 or more drinks in a row for men and 4 or more for women, at least once in past two weeks) and of activities perhaps influenced by it? “Have you engaged in unplanned sexual activities because of drinking alcohol?” 1993: 19.2% yes of n = 12,708 2001: 21.3% yes of n = 8,783 What is 95% CI for change saying “yes”?
Estimated change in proportion saying “yes” is 0.213 – 0.192 = 0.021. • 95% CI for change in population proportion is 0.021 ± 1.96(0.0056) = 0.021 ± 0.011, or roughly (0.01, 0.03) • We can be 95% confident that the population proportion saying “yes” was between about 0.01 larger and 0.03 larger in 2001 than in 1993.
Comments about CIs for difference between two population proportions • If 95% CI for is (0.01, 0.03), then the 95% CI for is (-0.03, -0.01). It is arbitrary what we call Group 1 and Group 2 and what the order is for comparing the proportions. • When 0 is not in the CI, we can conclude that one population proportion is higher than the other. (e.g., if all positive values for Group 2 – Group 1, we conclude that population proportion higher for Group 2 than Group 1)
When 0 is in the CI for differences, it is plausible that the population proportions are identical. • Example: Suppose 95% CI for change in population proportion (2001 – 1993) is (-0.01, 0.03) “95% confident that population proportion saying yes was between 0.01 smaller and 0.03 larger in 2001 than in 1993.” • Problem: 7.9 a
There is a significance test of H0: 1 = 2that the population proportions are identical, (i.e., difference 1 - 2 = 0) • “Have you engaged in unplanned sexual activities because of drinking alcohol?” 1993: 19.2% yes of n = 12,708 2001: 21.3% yes of n = 8,783 • Using z as the test statistic • z= (difference between sample proportions) / se • z = diff./se = 0.021/0.0056 = 3.75 • Two-sided P-value = 0.0002 • This seems to be statistical significance without practical significance! • Problem: 7.9 b
Case: Tekst på Call-To-Action link En hjemmeside, der tilbyder hjælp til træning af mave-muskler, www.sixpackabsexercises.com testede 3 varianter af teksten på et call to action link. Der stod følgende på de 3 links: ”Next page … • Read Sample of Book (=Control group) • Watch Video Preview • Watch my #1 Abs Exercise On Video” Kilde: http://visualwebsiteoptimizer.com/split-testing-blog/video-conversion-rate
Data Conclusions from visualwebsiteoptimizer.com: • Both calls to action that hinted at a video significantly increased the number of visitors who clicked to the sales page. • The best-performing variation (Watch Video Preview) increased conversion by (69,6 – 60,9)*100 / 60,9 = 14%.
Signifikanstest (A/B test) • Forudsætninger • Simpel tilfældig udvælgelse. • Minimum 10 obs. i alle kategorier. • Hypoteser • H0: • Ha: • Beregning af teststørrelse, z
Signifikanstest (A/B test) • Beregning af teststørrelse • z beregnes til 2,302 • Omregning af z til en signifikanssandsynlighed • Sandsynligheden for at observere z til 2,302 eller større er 0,0106 • Denne ssh. ganges med 2, hvilket giver en P-værdi på 0,0213 • Konklusion • Da P ≤ α(0,0213 ≤ 0,05) afvises H0. Det kan ikke skyldes tilfældigheder, at en højere andel konverterer, når teksten på CTA linket ”lokker” med en video fremfor en bog. Problem (5.13), 5.17 a-c
E-mærket casen www.houseofkids.dk flyttede sit e-mærke op ved siden af indkøbskurven og opnåede et løft i konversionsraten på 32%! Kilde: http://www.amino.dk/blogs/e-handel1/archive/2010/05/18/e-m-230-rket-virker-32-h-248-jere-konvertering.aspx