Download
1 / 2
20 likes | 180 Vues
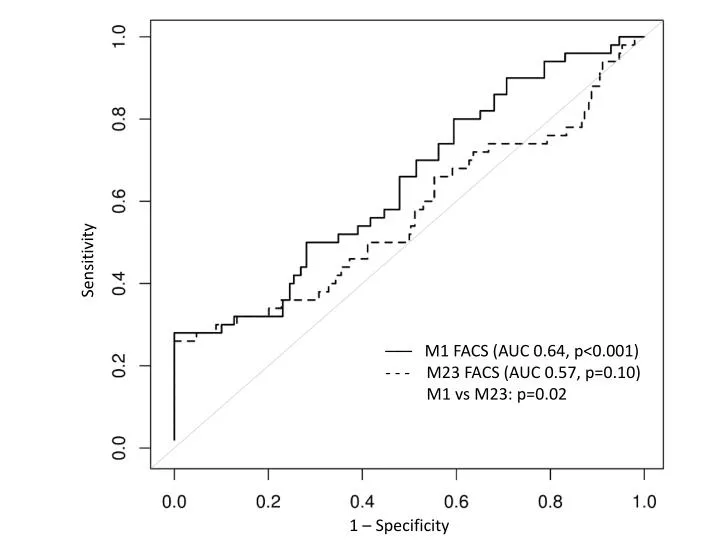
Sensitivity. ––– M1 FACS (AUC 0.64, p<0.001) - - - M23 FACS (AUC 0.57, p=0.10) M1 vs M23: p=0.02. 1 – Specificity. Supplemental Figure 2

E N D
Sensitivity ––– M1 FACS (AUC 0.64, p<0.001) - - - M23 FACS (AUC 0.57, p=0.10) M1 vs M23: p=0.02 1 – Specificity
Supplemental Figure 2 Receiver operating characteristic (ROC) analyses for AQP4-IgG detected by the M1-FACS and M23-FACS assays. Area under the curve (AUC) for M1-FACS= 0.64 (p<0.001). Area under the curve for M23-FACS= 0.57 (p= 0.10). The assay sensitivities were: M1-FACS, 83%; M23-FACS 75%. The assay specificities were: M1-FACS; 100%; M23-FACS, 95%. The light grey diagonal line indicates an AUC below which the performance of an assay has no diagnostic value. –––– M1 FACS (AUC 0.64, p<0.001) - - - - M23 FACS (AUC 0.57, p=0.10) M1 vs. M23: p=0.02