Download
1 / 1
10 likes | 157 Vues
Center Pixel. Mean Value of Pixels. Percent of Pixels that meet QC Criteria. The tool provides land cover grid (IGBP classification for Collection 4 shown) of the area, along with an estimate of heterogeneity (Shannon Diversity Index). Center Pixel Value. Mean Value of All Pixels.

E N D
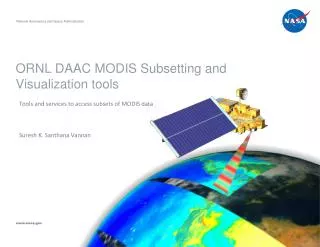
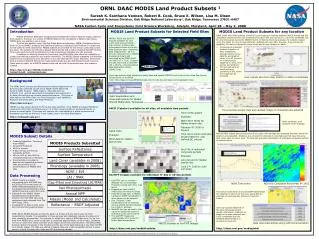
Center Pixel Mean Value of Pixels Percent of Pixels that meet QC Criteria The tool provides land cover grid (IGBP classification for Collection 4 shown) of the area, along with an estimate of heterogeneity (Shannon Diversity Index). Center Pixel Value Mean Value of All Pixels No data as yet in Collection 5 for most of 2003-2006 Percent of Pixels that meet QC Criteria ORNL DAAC MODIS Land Product Subsets1 Suresh K. Santhana Vannan, Robert B. Cook, Bruce E. Wilson, Lisa M. Olsen Environmental Sciences Division, Oak Ridge National Laboratory2, Oak Ridge, Tennessee 37831-6407 NASA Carbon Cycle and Ecosystems Joint Science Workshop, Adelphi, Maryland, April 28 – May 2, 2008 Introduction MODIS (Moderate Resolution Imaging Spectroradiometer) sensor data are highly useful for field research. However, the volume of MODIS data and the complexity in data format makes MODIS data less usable in some cases. To solve this usability issue, the Oak Ridge National Laboratory (ORNL) Distributed Active Archive Center (DAAC) prepares and distributes subsets of selected Land Products in a scale and format useful for field researchers. MODIS subsets are provided for more than 1,000 sites across the globe. The subsets are offered in tabular ASCII format and in GIS compatible GeoTIFF format. Time series plots and grid visualizations to help characterize field sites are also provided. In addition to offering subsets for fixed sites, the ORNL DAAC also offers the capability to create user-defined subsets for any location worldwide. The MODIS Global subsetting tool provides subsets from a single pixel up to 201x201 km for user-defined time range. Statistics, time series plots and GIS compatible files for the customized subsets are also distributed through this tool. Users place an order for a MODIS subset online and an email is generated when the subset is created. http://daac.ornl.gov/MODIS/modis.html Contact E-mail: ornldaac@ornl.gov MODIS Land Product Subsets for Selected Field Sites MODIS Land Product Subsets forany location ORNL DAAC also offers subsets of MODIS Land Products in comma delimited ASCII format and GIS compatible grid format for user-selected areas (from one pixel up to 201 x 201 km) worldwide and for any time period during the MODIS record.Unlike the fixed site subsets, the subsets created using the global tool are not automatically updated with new data. However, they provide the capability of creating subsets for larger areas and for any location on earth. MODIS ASCII and GeoTIFF Subsets available for over 1,000 field sites worldwide. Site inclusion is based upon willingness to share in situ site data (quid pro quo). Subsetted data (original size: 25 x 25 km) are received from a MODIS processing stream and converted at the ORNL DAAC into ASCII (7 x 7 km). Subsets are also converted to GeoTIFF (25 x 25 km), using Geospatial Data Abstraction Library (GDAL) Tools • Processing of subsetted product (selection of tiles, mosaicking, generating time series data file and graphs) takes 10 to 60 minutes for most products (depends on area, time period, and product) • The tool will send an email message containing a URL where the output can be accessed 1,052 Sites Users can access a Web interface to select sites and specific MODIS Land Products from Web Map Server, Google Earth, or a picklist. Visit http://daac.ornl.gov/MODIS/modis.html for site list and maps and visualization links. User selects site from map, picklist or enters coordinates Background The ORNL DAAC archives and distributes terrestrial biogeochemical dynamics data collected as part of the NASA's Earth Observing System (EOS) Program. ORNL DAAC's ~800 data sets are primarily from ground-based field investigations and augmented by data collected through remote-sensing techniques. The types of data held by the ORNL DAAC are Field Campaign, Land Validation, Regional and Global Data, and Model Products. http://daac.ornl.gov/ Data Visualization and Download options for Walker Branch Watershed- Tennessee MODIS is a key sensor aboard the Terra and Aqua satellites. Terra MODIS and Aqua MODIS are viewing the entire Earth's surface every 1 to 2 days, acquiring data in 36 spectral bands, or groups of wavelengths. These data will improve our understanding of global dynamics and processes occurring on the land, in the oceans, and in the lower atmosphere. http://modis.gsfc.nasa.gov/ ASCII (Tabular) available for all sites, all available time periods Tool provides Google map and Landsat image of sinusoidal area selected Time-series graphs Example: NDVI Time series for Walker branch site. February 8th 2000 to Present Time series plots could also be generated for user defined QC criteria Order summary and example email message. ASCII Data Example: NDVI data for Walker branch site. MODIS NDVI subset data presented as time series, with average and standard deviation shown for pixels in area selected. Statistics are provided for all pixels in selected area that have the same land cover class as center pixel. The tool also provides visualization of individual composite periods in rainbow colors. MODIS Subset: Details • Products Subsetted: Terra and Aqua MODIS • Sinusoidal Projection • 2000 to present • 8-day, 16-day, and annual composite periods • 250-m, 500-m, and 1000-m resolution (Depends on Product) • Documentation provided to describe the subsetted products; links are provided to full documentation at MODIS Web sites Grid Plot of individual composite periods Example: LAI grid plot for Walker branch site June 17th 2000 to June 24th 2000 Data Processing GeoTIFF Images available for individual 8- day or 16-day periods • MODIS fixed site subsets reformatted from HDF-EOS into ASCII/GeoTIFF format using LP DAAC’s MODIS Reprojection Tool, Geospatial Data Abstraction Library (GDAL) tools and custom Perl code • Subsets for the MODIS Global subsetting tool are generated directly from HDF-EOS tiles using customized code obtained from The HDF Group (THG) • Visualization of data is done using Perl code and Perl graphics library • GeoTIFFs can be viewed in WebGIS Tool (in Sinusoidal Projection) along with other map layers • Example at right is NDVI (MOD13Q1) for sites in Europe • Underlying map layer is MODIS Landcover (IGBP Classification); other layers can be selected • Site / Product / Date combinations can be selected using a picklist and downloaded for a date or all dates • WebGIS Tool can be used to filter values or determine values of individual pixels (lower panel) • The GeoTIFF images are automatically color scaled for better data interpretation NDVI Time series NDVI for Composite Period May 9th 2002 Users can access ASCII file of the pixel values along with quality information, statistics on pixels in the area selected, and a GIS compatible grid file. Detailed documentation is provided for each file. ORNL DAAC MODIS Subsets provide the data in a format and size that is easy for field researchers to handle. The availability of these subsets also drastically reduces the amount of time needed to process data. For example, to obtain four years of NDVI data for a 7x7 sq. km area from MODIS tiles, users would have to download approximately 10 GB of data. Extracting 7x7 sq. km area from nearly 200 tiles would require lot of time and resources. The ORNL DAAC however deliver the subset in few minutes and the size of the data delivered is less that 100 MB for a similar subset. The data are offered in tabular files and in GIS compatible format to allow users to import the data into a data and GIS processing package. Data download options along with Documentation MODIS Subsets as GeoTIFF Images http://daac.ornl.gov/modisfixedsite http://daac.ornl.gov/modisglobal 1This study was supported by the NASA’s Earth Observing System Data and Information System.2Managed by the University of Tennessee-Battelle LLC under contract DE-AC05-00OR22725 with the U.S. Department of Energy