Download
1 / 37
370 likes | 498 Vues
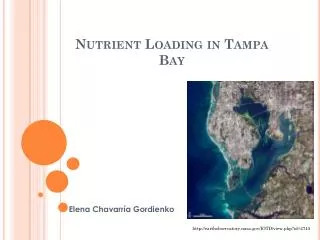
Status of WWTF Nutrient Reduction Efforts For Narragansett Bay. Angelo S. Liberti, Chief Surface Water Protection Office of Water Resources 401.222.4700 ext 7225 angelo.liberti@dem.ri.gov. Surface Water Protection Major Program Responsibilities.

E N D
Status of WWTF Nutrient Reduction Efforts For Narragansett Bay Angelo S. Liberti, Chief Surface Water Protection Office of Water Resources 401.222.4700 ext 7225 angelo.liberti@dem.ri.gov
Surface Water Protection Major Program Responsibilities • Designate Water Quality Classifications • Establish Water Quality Standards • Evaluate all waters for Compliance (Integrated Report) • List Waters in violation of WQS (303d list) • Develop Restoration Plans (TMDLs) • Issue Permits Requiring Implementation (RIPDES etc.) • Review Abatement Plans
State Water Quality Standards • Reflected in DEM Water Quality Regulations • Subject to EPA approval • Consistent with national guidance; no less stringent • Site specific criteria are allowed • Criteria can account for naturally occurring conditions • Current focus: nutrient criteria and biocriteria development
Current Estuarine DO Criteria • Above a seasonal pycnocline, not less than 4.8 mg/l at any place or time more than once every three years, except as naturally occurs • Below the pycnocline, instantaneous values below 4.8 are acceptable provided: • not less than 2.9 for any 24 hour period May 1-October 31 • Not less than 1.4 mg/l for more than 1 hour more than twice May 1-October 31 • cumulative exposure to DO less than 4.8 mg/l doesn’t exceed prescribed values.
Use Attainability Analysis • Mechanism required under the Clean Water Act to reach a decision that a specific waterbody will not be able to achieve its designated uses • Not widely used in New England • Key factors in UAAs: Demonstration of widespread economic harm
UAA Example: Pawtuxet River • Completed in early 1980’s for the Main Stem of the Pawtuxet River • Revisited in response to a February 16, 1988 letter from the Mayors of Cranston and Warwick and the West Warwick Council President. • “ The theoretical water quality required for this use [propagation of fish] is impossible to meet …” • “… take whatever other steps are necessary to eliminate the need for advanced wastewater treatment plants along the Pawtuxet River.”
Water Quality Assessment Process • TMDLs are not a prerequisite for issuance of discharge permits
Estuarine Waters Listed as Impaired (DO) • Providence and Seekonk Rivers (since 1994) • Potter Cove (1998) • Greenwich Bay & Coves (1998) • Upper Narragansett Bay (2000) • East &West Passages (2008) • Palmer River (1992) • Wickford Harbor (1994) • Pawcatuck (1994) • Mt. Hope Bay (1998) • Greenhill Pond (2002)
2008 Expansion of DO Impairment • In its Intergrated Report on statewide water quality conditions, DEM expanded the area in the mid-bay designated as impaired due to low DO.
Early Focus: Providence and Seekonk Rivers • “Available data show a marked lowering of dissolved oxygen levels in surface and bottom waters in the Providence River at least during the warmer months Reduced oxygen levels at times extend down Bay. (Olsen and Lee 1979) • “The lowest oxygen values throughout the channel bottom were recorded on the August 8, 1980 sampling, those values were 0 to 3 mg/l all the way to Conimicut Pt.” (Oviatt 1979-1980) • SPRAY& SQUIRT Cruises – 7 surveys (high and low tide samples), 3 summer surveys of DO, June and August 1987, September 1989 Ave bottom oxygen all Providence and Seekonk River Stations: 3 mg/l –4 mg/l
Expanded Data Collection Efforts • DEM – 1995 1996 Total of 11 High and low tide surveys. • 1995 extreme variations in oxygen and chlorophyll, periods where entire area is <4mg/l, bottom waters in significant portions of the Seekonk and Providence frequently 0-1 mg/l. 1996 mid June-late September bottom DO rarely above 4 down to Conimicut Point, typically near 0 down to Sabin Pt. • Insomniacs – multi-agency, monthly, overnight surveys 1999-2003, 2005 and continuing • Fixed-Site Monitoring Network Expansion: DEM, in partnership with NERRS, the NBC and URI-GSO added stations: from 7 to 9 stations during the summer of 2003; from 9 to 12 summer of 2005; from 12 to • NOAA- Bay Window – shuttle surveys; 1998-present, monthly bay-wide transects
Prior Modeling Efforts – Providence & SeekonkRivers • July -December 1989 – Narragansett Bay Project formed a Water Quality Model Technical Advisory Group and hired Limno-Tech to provide recommendations to the group. • January 1990 – NBP held a workshop with stakeholders to discuss TAC recommendations and plan for development of a model to establish an abatement strategy. • 1992-Researchers at EPA Lab in Narragansett produced Providence Seekonk DO and Nitrogen Model (Dettman 1992) • Collection of additional data to support development of a time dependent model that includes phytoplankton
1992 – NBP hired Limno-Tech to enhance the model produced by Dettman (include impacts from phytoplankton and time variable predictions) • Model not designed to capture variability of short term events observed due to high algal productivity • Over 50% reduction in Nitrogen needed to produce an observable response (higher levels for significant response) • To improve model reliability need, additional data, improved understanding of advective flow variations and extend southern boundary of the model. • Reliability in the current screening model is substantial and provides good indication of the impact of reduced nitrogen loads on phytoplankton levels. • DEM developed sampling program to support development of a time variable, three dimensional hydrodynamic/water quality model –formed TAC, Tetra Tech was hired to review past modeling efforts and the proposed sampling/modeling strategy. • DEM engaged ASA to developed a linked hydrodynamics and water quality model. 1997-2001 held TAC meetings regarding model development. Problems encountered when modeling the interaction between the deep channel and shallow flanks of these water bodies, the mass transport component of the model system could not be successfully calibrated and validated.
Preliminary WWTF Nitrogen Reduction Plans • 1998 - RI WWTF Loading Reduction Analysis • 7 WWTFs required to reduce ammonia agreed to reduce total N
Current Plan for Managing Nutrients • Work was already underway • Greenwich Bay Fish Kill – August 2003 • Draft Plan for nutrient reductions (DEM, Feb. 2004) • Governor’s Commission Report & Legislation – 2004 • Adoption in law of goal of 50% reduction in N loadings - 2004 • DEM permits issued – June 2005
Revised WWTF Nitrogen Limits • 8 mg/l • No. Attleborough • Attleboro • Grafton • Uxbridge • Northbridge • (max extent) • East Providence • Cranston • West Warwick • Warwick • Smithfield (10 mg/l) • Burrillville (max extent) • 5 mg/l • UBWPAD • Woonsocket • NBC-Fields Pt. • NBC Bucklin Pt. • East Greenwich - Warren – anticipated to address impacts to the Palmer River • Limits May – October, require operation of treatment to remove N to max extent possible November-April
Status of Compliance with Revised Permit limits for NRI WWTFs * Excludes May data (19.5, 13 mg/l)
Status of Compliance with Revised Permit limits for NRI WWTFs (Cont.) * Excludes May data (19.8, 24.0 mg/l)
Status of Compliance with Revised Permit limits for NMA WWTFs
Significance of MassachusettsWWTFs • Without reductions at MA WWTFs • Decrease in loading delivered to the Providence Seekonk River system will change from 59% to 39% below current levels. • Seekonk River: 57% reduction with full participation (loading factor is reduced from 23X to 10X) only 7% (to 21.5X) without reductions at MA facilities
Nitrogen Reduction Projections • Nitrogen removal at 11 RI WWTFs - reduces their summer season nitrogen loading by 65%, dropping to 48% as WWTF flows reach approved design flows.
Current Status of Load Reduction Efforts • 8 - WWTFs have complete upgrades • (2 require additional modifications) • 0 - Under construction • 3 – Planning Underway • NBC Bucklin Point • Woonsocket • East Providence • 1 - Design Underway • NBC Fields Point
Things on “Management’s Plate” • What further reductions will be needed and where? “going to 3 mg/l” • Establishment of new shellfish closure procedures in response to CSO tunnel. • How best to update predictive tools to modify shellfish closure area procedures in response to sewer overflows and to develop monitoring strategies. • How will CSO tunnel operations affect water quality beyond the control of pathogens? • Manchester Street Power Station permit renewal
Side helpings… • Need to better understand what is happening in Greenwich Bay; e.g. groundwater inputs. • Does monitoring need to be modified to better answer questions about how the Bay’s ecology is changing?
Table 4: Approved WWTF design flows and design flows used for the load evaluations. Table 4: Approved WWTF design flows and design flows used for the load evaluations. Evaluation of WWTF Load Reductions
Allowable Loading Condition Average Chlorophyll vs N Load 70 32 X y = 0.62 x + 6.32 2 R = 0.94 60 50 16 X 40 Chlorophyll a (ug/l) 30 4 X 20 8 X 2 X 10 1 X C 0 0 10 20 30 40 50 60 70 80 90 100 2 Nitrogen Load (mmol/m /d)