Download
1 / 16
160 likes | 314 Vues
Cassie Tamblyn Gainesville State College Fall 2012. Multi-Sensor Land Cover Mapping Using GEOBIA and Exploring E. Coli Correlations. OBJECTIVE.

E N D
Cassie Tamblyn Gainesville State College Fall 2012 Multi-Sensor Land CoverMapping Using GEOBIA and Exploring E. Coli Correlations
OBJECTIVE • Use geographical object based image analysis (GEOBIA) to determine if there is a correlation between land cover classification and E. coli levels within the Flat Creek Watershed and its subwatersheds
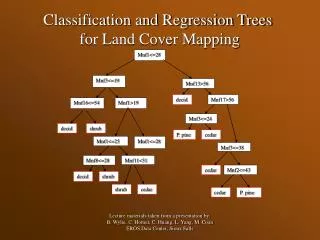
BACKGROUND • GEO-Object Based Image Analysis • Looks at images as groups of objects rather than pixels • More like how we see images • Can use many layers to delineate objects • Yields more accurate results (when applied properly) • E. Coli contamination • Easy way to measure fecal contamination • 100 cfu’s allowed during spring months for fishing waters
DATA USED • 15 LiDAR tiles (1.5m posts), 2010 • 42 CIR tiles (0.1524m spatial resolution), 2010 • Flat Creek watershed boundary & subwatershedboundary shapefiles (created using ArcHydro) • E. Coli measurements during March & April 2012 (from Upper Chattahoochee Riverkeepers)
SOFTWARE USED • ArcHydro • Delineate watershed • Quick Terrain Modeler • Create nDSM (DSM-DEM) • ERDAS Imagine • Mosaic imagery • eCognition Developer • Develop and process rule set • ArcMap • Develop Map Layout
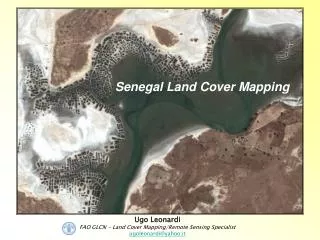
AREA OF INTEREST • Flat Creek Watershed (divided into 5 subwatersheds) • Total area = 20,000,000 m2 • Flat Creek starts in Gainesville and flows in a southwesterly direction to Lake Lanier • One of the most impacted streams of Georgia • Most of land within watershed is covered by impervious surfaces • Industrial district contains chicken processing plants and other factories • Some agricultural land
POST PROCESSING RULE SET • After processing entire AOI on the server & merging the data again….
ANALYSIS • No correlation was found by this assay in this watershed • No manual editing was done which may improve accuracy which could in turn improve correlation • Point sources could be added to correlation factor