Download
1 / 11
110 likes | 263 Vues
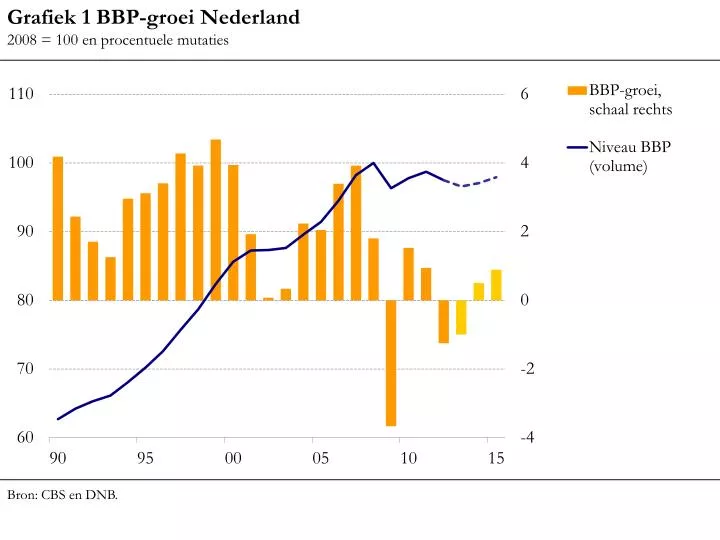
Grafiek 1 BBP-groei Nederland 2008 = 100 en procentuele mutaties. Bron: CBS en DNB. Grafiek 2 Bronnen van bbp -groei Nederland Procentuele mutaties en procentpunten.

E N D
Grafiek 1 BBP-groei Nederland 2008 = 100 en procentuele mutaties Bron: CBS en DNB.
Grafiek 2 Bronnen van bbp-groei Nederland Procentuele mutaties en procentpunten Toelichting: Netto bijdragen aan bbp-groei, waarbij de finale en gecumuleerde intermediaire invoer in mindering zijn gebracht op de bijbehorende afzetcategorieën. Bron: CBS en DNB.
Grafiek 3 Arbeidsmarkt en inflatie Procenten beroepsbevolking en procentuele mutaties jaar op jaar Bron: CBS, DNB en Eurostat.
Grafiek 4Inflatie (HICP) in Nederland Procentuele mutaties en bijdragen (procentpunten) Bron: CBS, DNB en Eurostat.
Grafiek 5 Loonvoet bedrijven Procentuele mutaties en procentpunten Bron: CBS en DNB.
Grafiek 6 Marktaandeel uitvoer goederen en diensten Index 2008 = 100 en verschil in procentuele mutaties; volume Toelichting: Index is desbetreffende categorie gedeeld door relevante wereldhandel . Bron: CBS, DNB en ECB.
Grafiek 7Waarde-aandelen Nederlandse uitvoer in 2009 Procenten Toelichting: Uitvoer in termen van toegevoegde waarde naar eindgebruik. 1. Exclusief China Bron: CBS en OESO.
Grafiek 8 Individuele en collectieve besparingen Procenten beschikbaar inkomen¹ 1. Inclusief correctie pensioenvoorziening. Bron: CBS en DNB.
Grafiek 9 Investeringen naar type activa, exclusief woningen Procentuele mutaties kwartaal op kwartaal Toelichting: Inclusief overheid. De post overig is inclusief een statistisch verschil. Bron: CBS en DNB.
Grafiek 10 Huizenprijzen Procentuele mutaties Bron: CBS, Kadaster en DNB.
Grafiek 11 Achterblijvende investeringen in het eurogebied 2000K1 = 100 Toelichting: Bedrijfsinvesteringen exclusief woningen (volume) in het eurogebied zijn bepaald als het gewogen gemiddelde van de investeringen in België, Duitsland, Finland, Frankrijk en Nederland. Bron: OESO.