Download

1 / 21
210 likes | 507 Vues
15. Extending the Analysis of Aggregate Supply. Chapter Objectives. The Relationship Between Short-Run Aggregate Supply and Long-Run Aggregate Supply Applying the Extended AD-AS Model to Inflation, Recessions, and Unemployment

E N D
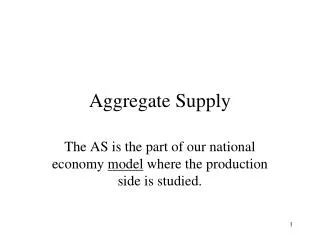
15 Extending the Analysis of Aggregate Supply
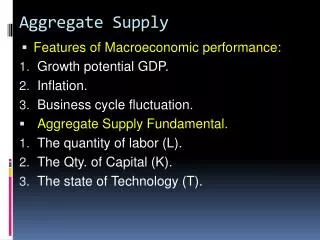
Chapter Objectives • The Relationship Between Short-Run Aggregate Supply and Long-Run Aggregate Supply • Applying the Extended AD-AS Model to Inflation, Recessions, and Unemployment • The Short-Run Tradeoff Between Inflation and Unemployment (Phillips Curve) • Why There is No Long-Run Tradeoff Between Inflation and Unemployment • Relationship Between Tax Rates, Tax Revenues, and Aggregate Supply
From Short Run To Long Run • Short Run • Long Run • Short-Run Aggregate Supply • Long-Run Aggregate Supply Graphically
From Short Run To Long Run Short-Run Aggregate Supply Long-Run Aggregate Supply AS1 ASLR AS2 AS1 a2 a2 AS3 b1 P2 P2 Price Level Price Level a1 a1 P1 P1 a3 a3 P3 P3 c1 Q3 Qf Qf Q2 Real Domestic Output Real Domestic Output
G 15.1 From Short Run To Long Run Equilibrium in the Extended AD-AS Model ASLR AS1 Price Level a P1 AD1 Qf Real Domestic Output
From Short Run To Long Run Demand-Pull Inflation in the Extended AD-AS Model AS2 ASLR AS1 b P3 c P2 Price Level a P1 AD2 AD1 Qf Real Domestic Output
From Short Run To Long Run Cost-Push Inflation in the Extended AD-AS Model If Government Counters Recession With Spending… If Government Ignores Recession… AS2 ASLR AS1 c P3 b P2 Price Level a P1 AD2 AD1 Qf Real Domestic Output
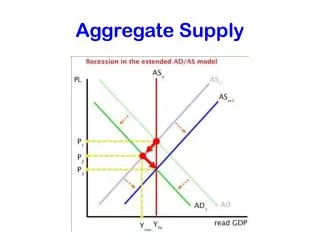
From Short Run To Long Run Recession in the Extended AD-AS Model AS1 ASLR AS2 a P1 b P2 Price Level c P3 AD1 AD2 Q1 Qf Real Domestic Output
The Inflation-Unemployment Relationship The Short-Run Effect of Changes on Real Output and the Price Level AS P3 Price Level P2 AD3 P1 AD2 P0 AD1 AD0 0 Q0 Q1 Q2 Q3 Real Domestic Output
O 15.1 Annual Rate of Inflation (Percent) Annual Rate of Inflation (Percent) Unemployment Rate (Percent) Unemployment Rate (Percent) The Inflation-Unemployment Relationship • The Phillips Curve • Inverse Relationship • Inflation and Unemployment Concept Empirical Data Data for the 1960s 69 68 66 67 65 63 62 61 64
The Inflation-Unemployment Relationship • Adverse Supply Shocks and the Phillips Curve • Stagflation • Adverse Aggregate Supply Shocks • OPEC Oil Price Shock • Stagflation’s Demise
O 15.2 The Inflation-Unemployment Relationship • Long-Run Phillips Curve • Short-Run Phillips Curve • Long-Run Vertical Phillips Curve • Disinflation
15 12 9 6 3 3 4 5 6 The Inflation-Unemployment Relationship The Long-Run Vertical Phillips Curve PCLR PC3 b3 PC2 a3 b2 Annual Rate of Inflation (Percent) PC1 a2 c3 b1 a1 c2 0 Unemployment Rate (Percent)
Taxation and Aggregate Supply • Supply-Side Economics • Tax Incentives to Work • Tax Incentives to Save and Invest • The Laffer Curve 100 n Laffer Curve Tax Rate (Percent) m m Maximum Tax Revenue l 0 Tax Revenue (Dollars)
Taxation and Aggregate Supply • Criticisms of The Laffer Curve • Taxes, Incentives, and Time • Inflation and Higher Real Interest Rates • Position on the Curve • Rebuttal and Evaluation
Tax Cuts for Whom? Last Word A Supply-Side Anecdote • 10 People Have Breakfast Together for $100 • Charges are Divided in the Way Americans Pay Taxes • 4 Poorest Pay Nothing, Fifth Pays $1, Sixth Pays $3, Seventh Pays $7, Eighth Pays $12, Ninth Pays $18, Tenth the Richest Pays $59 • Works Fine Until Price is Cut by $20 – How to Divide the Cut?
Tax Cuts for Whom? Last Word A Supply-Side Anecdote • $20 Divided by 6 = $3.33 Resulting in Fifth and Sixth Being Paid to Eat Breakfast • Cook Suggests Dividing Proportionate to Price Paid by Each • Results in First 5 Paying Nothing, Sixth $2, Seventh $5, Eighth $9, Ninth $12, and Tenth Pays $52 • Each of the Paying 6 are Better Off Than Before
Tax Cuts for Whom? Last Word A Supply-Side Anecdote • Conflict Erupts Over Who Got How Much Relief – The Majority Going to the Richest • When Confronted the Richest Diner Didn’t Come the Next Day. • Surprise – They were $52 Short Without the Richest Payer
Tax Cuts for Whom? Last Word A Supply-Side Anecdote • Morals: People Who Pay the Most Taxes Reap the Most Benefit From Tax Cuts • Redistributing Tax Reductions at the Expense of those Paying the Highest Taxes May Produce Unintended Consequences!
short run long run Phillips Curve stagflation aggregate supply shocks long-run vertical Phillips Curve disinflation supply-side economics Laffer Curve Key Terms
Next Chapter Preview… Economic Growth Chapter 16!