Download

1 / 22
220 likes | 388 Vues
Colour in Images. Roy G. Biv. Spectrum of colours: red, orange, yellow, green, blue, indigo and into violet. I. Experiment of I. Newton, 1672,. Prism does not colouring the light! The order of the colours in the spectrum is consistent!

E N D
Roy G. Biv Spectrum of colours: red, orange, yellow, green, blue, indigo and into violet. • I. Experiment of I. Newton, 1672, Prism does not colouring the light! The order of the colours in the spectrum is consistent! Each colour has a unique signature identifying its location in the spectrum! • II Experiment of I. Newton Roy G. Biv
Wavelength of Light • The signature of colour is the wavelength of light. • Less than 100 years after Newton's discoveries, James Clerk Maxwell showed that light was a form of electromagnetic radiation. This radiation contains radio waves, visible light and X-rays. Fig: The electromagnetic spectrum, which encompasses the visible region of light, extends from gamma rays with wave lengths of one hundredth of a nanometer to radio waves with wave lengths of one meter or greater.
The nanometer is a unit of distance in the metric scale and is abbreviated as nm. 1 nm = 10^(-9) m Red light has a wavelength of 680 nm Electromagnetic radiation with wavelengths of 410 nm Fig: A wave representation of three different light hues: red, yellow-green and violet, each with a different wavelength, which represents the distance between wave crests.
Light We can describe light as electromagnetic waves with colour identified by its wavelength or as a stream of minute packets of energy-photons - which create a pulsating electromagnetic disturbance (electron volt, abbreviated eV.)
Colour of the objects Objects can be thought of as absorbing all colours except the colours of their appearance: Fig: White light composed of all wavelengths of visible light incident on a pure blue object. Only blue light is reflected from the surface.
The Eye and Colour Sensation Colour is perceived in the retina by 3 sets of cones which are photoreceptors with sensitivity to photons whose energy broadly overlaps the blue, green and red portions of the spectrum. Colour vision is possible because the sets of cones differ from each other in their sensitivity to photon energy. Figure: A cross-sectional representation of the eye showing light entering through the pupil. The photosensitive cells, cones and rods, are located in the retina: cones respond to colour and rods respond to light intensity
The sensitivity of the cones to light of the same intensity but different wavelengths Fig: The response to incident light: cone R (pigment R) has a maximum sensitivity in the orange-red, cone G (pigment G) in the green-yellow, and cone B (pigment B) in the blue portions of the visible spectrum. The sensitivities of the three cones overlap and the perceived colour is due to the relative response of the three cones.
Colour Representation in Imaging James Clerk Maxwell's Colour Triangle Fig: The colour triangle. The primary colours / the subtractive colours. Many, but not all colours can be represented as a mixture of the three colour lights. The nearer a point is to an apex, the higher is the proportion of light of the colour represented by that apex.
Representing All Colours: Commission Internationale de l'Eclairage (CIE), 1931 (1967) • The CIE chromaticity diagram showing wavelengths in nanometers (nm) and energies in electron volts (eV). • The area enclosed by the curved line and dashed segment include all visible colours. The pure spectral colours lie along the curved edge. • The central point W of the diagram is the white produced by an equal mixture of the three primaries.
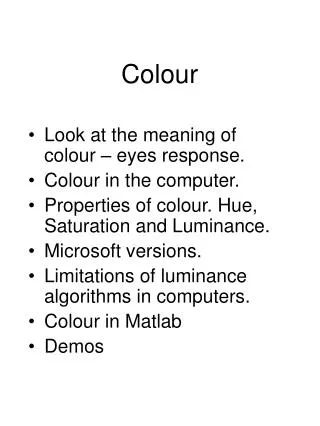
Hue Saturation Intensity • Hue, H, specifies the dominant pure colour perceived by the observer. The sensation of colour can be described in terms of hue. • Saturation, S, specifies the degree to which a pure colour has been diluted by white light to produce observed colour. The dominant wavelength points on the spectral curve are fully saturated • Intensity, I, is related to the perceived brightness of the colour. Different ways of obtaining metameric beams of pink light. Each implies mixture with white light to obtain pink light, A) by orange light, B) by mixing red with cyan, or C) by mixing red, green, and violet. To the eye, these metameric colours would all appear the same
The HSI Cone Intensity White Hue Green Yellow Cyan Red Saturation Blue Magenta Black
Colour in analogue TV signals • Colour is stored separately from Luminance to retain compatibility with Black&White televisions. • Less bandwidth is used to store the chrominance (colour) signals than the Luminance (brightness) .... • This is because the human eye is much more sensitive to brightness changes than colour changes (colour in broadcast television signals is a bit of an approximation to true colour).
Automatic Colour Processing • Broadcast television signals and compressed images (e.g. JPEG) on a computer use humans lack of colour perception to ‘compress’ images without loss of perceptual quality. • [i.e. fit it into less memory or radio bandwidth] • Information IS lost however and often such signals are not suitable for accurate automatic colour analysis. • Higher quality (and bandwidth) digital cameras are now available that preserve colour information for automatic processing (at a price!)
Image Processing in Colour • Image processing operations (such as contrast enhancement) may be applied on each channel (R,G,B,H,S,I etc) separately or on combinations/subsets of channels. • Intensity invariant representations (e.g. HS) are often used to model colour (to normalise out lighting), however noise at low intensities is an issue. • Many image processing operations are simply carried out on intensity (grey-scale) images.
Colour Image Processing It is possible to use colour information with specific colour orientated methods to understand images. For example .... Colour Histograms:
Colour Histograms • Each bin (graph block) represents the number of times a pixel within a particular colour range has occurred. • e.g. between 0 and 5 Hue and 10 and 20 saturation • The wider the range the less bins (and the more general the histogram)
Colour Histograms Application 1:Image Comparison • Two images containing the same objects will have roughly similar colour histograms even if the spatial arrangement of these objects is different. • Various quantitative measures can be used to compare 2 histograms e.g. ‘sum of absolute difference’, ‘sum of squared difference’ and ‘cross entropy’.
Image Databases • Image databases can contain large numbers of images so searching manually for an image is not possible. • If they are annotated keyword searches can be used as in traditional databases. • Alternatively a query can be a know image and images that are ‘similar’ to this image may be retrieved. • Colour methods (such as colour histogram comparison) may be used in this search
Colour Histograms Application 2:Skin Segmentation A histogram is calculated from a patch of the image This is used to classify each pixel in the complete image(i.e. if frequency in bin relating to pixel > threshold classify as skin)
Introduction to image processing in MatLab • Online manual for the Image Processing Toolbox • A digital image is composed of pixels which can be thought of as small dots on the screen. • Each pixel has intensity value, which represent the pixel ‘colour’ • You can load / save / display/convert image to different formats • MatLab support BMP/ HDF /JPEG /PCX /TIFF/XWB image formats
Some Interesting Facts • How many colours we actually need to describe an object? • What colour representation can be used for? • Human observers and colour image quality • Perceptual colour differences between two colour images