Download
1 / 25
250 likes | 383 Vues
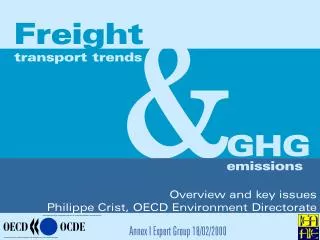
&. Freight transport trends. GHG emissions. Overview and key issues Philippe Crist, OECD Environment Directorate. Transport: ~26% of OECD CO 2 emissions. Freight: ~30-40% of transport CO 2 emissions. CO 2 Emissions from Freight: Context. CO2 from Freight. Drivers.

E N D
& Freight transport trends GHGemissions Overview and key issues Philippe Crist, OECD Environment Directorate
Transport: ~26% of OECD CO2 emissions Freight: ~30-40% of transport CO2 emissions CO2 Emissions from Freight: Context
CO2 from Freight Drivers Activity/Volume Structure/Mode Share Intensity/Energy Efficiency Fuel
Activity Micro level Derived Demand: Siting, transport links (rationalisation of supply base: increase in transport distances of 1.5-2% in EU) Macro Level GDP, freight transport (3.4%/yr, 5.4%/yr road), geography & economy
US UK Netherlands Japan w. Germany Tonne-km / Capita Australia Sweden 10000 15000 20000 25000 GDP / Capita (90 US$ PPP) Total Freight Volume and GDP: Correlation and variability 20 15 10 5 Source: IEA 0 5000
Mode Share Road Rail Shipping Air
Road Freight Transport 44% of OECD t/km (higher value/shorter distances) Gaining share everywhere
United States EU-15 Japan Road Freight Growth tonne/km 2000 1750 1500 1250 1000 million tonne/kilometres 750 Source: OECD, EEA, USDOT 500 250 0 1970 1975 1980 1985 1990 1995
Road Freight Transport Benefiting from shifts in production patterns and product cycles Congestion Role of transport market liberalisation
Rail Freight Transport 36% of OECD t/km (lower value/longer distances) Absolute gains, relative losses
United States EU-15 Japan Rail Freight Growth tonne/km 2000 1750 1500 1250 1000 million tonne/kilometres 750 Source: OECD, EEA, USDOT 500 250 0 1970 1975 1980 1985 1990 1995
Rail Freight Transport Increase in intermodal systems Market deregulation Infrastructure issues
Inland (and Coastal) Shipping Inland shipping ~20% OECD tn/km (low value/long distances) Absolute gains, relative losses Globalisation benefits shipping
United States EU-15 Japan Shipping Freight Growth tonne/km 2000 1750 1500 1250 1000 million tonne/kilometres 750 Source: OECD, EEA, USDOT 500 250 0 1970 1975 1980 1985 1990 1995
Airborne Freight Transport Low absolute levels, highest growth (medium to high value goods, long distances) Rel. low costs (for high value goods), short product and production cycles drivers Globalisation benefits air
Energy Intensity Function of mode share, technical efficiency, and load factors
1800 1600 1400 Indirect emissions Direct emissions 1200 1000 GHG Emissions in CO2 equivalent g/tkm 800 600 400 200 0 Light Light HGV 16 HGV 28 HGV 40 Rail Rail Rail Inland Maritime van van tonne tonne tonne Air combined combined wagon Shipping Shipping gasoline diesel Euro2 Euro2 Euro2 container piggy UCPTE Lifecycle GHG Emissions European Freight Transport Modes Source: INFRAS, Zurich
Energy Intensity Technical efficiency improvements: ambiguous-- Lorry 20-30% improvements not translated into energy intensity improvements per t/km Improvements in other areas: Driver training, logistics chain management, vehicle utilisation, etc.
Road Freight Loading UK Survey Results 54% of trips were 24% of trips to more than 1.7m loaded to between 17% to between 1.5m and 0.8m 1.5m and 1.7m and 5% under 0.8m 2.4m Source: A. McKinnon, Heriot-Watt Univ. Tonne-out vs. Square out vs. Cube-out
Variability in Fleet Energy Intensity 1998 UK Lorry Fleet Survey Source: A. McKinnon, Heriot-Watt Univ.
Potential Fuel Savings from Best Practice 1998 UK Lorry Fleet Survey if fleets below mean if fleets below mean of top 1/3, achieve performance achieve mean performance mean performance of top 1/3 motive fuel savings 4,670,336 14,726,121 litres reduction on current 9 29 % level of fuel use reduction in CO 2 12,423 39,171 tonnes emissions cost saving per 2,255 7,109 £ vehicle Source: A. McKinnon, Heriot-Watt Univ.
Fuels Petroleum-based fuels dominate Ambiguity of fuel prices for firm-level strategic decision-making Little use of alternative fuels, stock turn-over, questions re. Fuel cells
Logistics costs = 7.5% of sales revenue Road transport costs = 30% of logistics costs Fuel = 25-30% of road transport costs Fuel = 0.6 - 0.7 % of sales revenue Road Fuel Costs in Perspective EU data Source: A. McKinnon, Heriot-Watt Univ.
Policy Issues Unit gains vs. Volume effects Technology vs. Practices Different discourses/different agendas Instruments: Relevant? Fuel prices? Congestion? Action now, impacts later De-coupling Economic Activity and Freight transport volume
Voluntary reduction of CO2 emissions: - 45% from 1993 to 2005 Source: Arretz, Otto-Versand