Understanding Experimental Research Methods: Differences in Two Groups Analysis
This overview delves into the foundational aspects of experimental research methods focused on analyzing differences between two groups. It covers techniques such as prospective randomization, manipulation, and control to establish causality among variables. Key considerations of validity, including internal, external, and construct validity, are explored alongside statistical processes for analysis. The document provides insights into measurement scales, normal distribution testing, and the framework for hypothesis testing, offering a comprehensive resource for researchers aiming to ensure reliable and valid results in their experiments.


Understanding Experimental Research Methods: Differences in Two Groups Analysis
E N D
Presentation Transcript
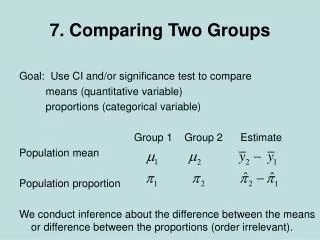
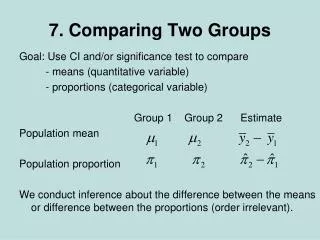
Content Experimental Research Methods: Prospective Randomization, Manipulation Control Research designs Validity Construct Internal External Statistical Process for Analysis of Difference Scale of Measurement Z and t
Research Steps Overview http://www.experiment-resources.com/
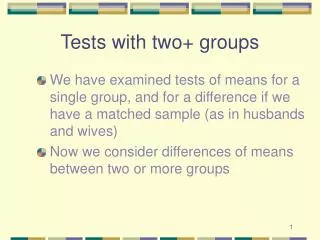
Experimental Research • Prospective Analysis of Difference • Random selection and assignment of participants to treatment and conditions • Manipulation and control used to establish causality between variables • Investigator manipulates and controls participants and conditions
Methods: • Theoretical framework “a priori” • Participant selection and assignment random • Precision of Measurement • Numerical Data • Manipulation Present • Control Maximized
Two Group Experimental Designs R X integrated treatment O R X standard of care O Or Change Score R O X integrated treatment O O-O = Δ R O X standard of care O O-O = Δ Key: R = Random Assignment X = Treatment O = Measurement Observation
Validity • Internal Validity “truth in the experiment” • How sure are you that the manipulation of the independent variable caused the outcome in the dependent variable? • Construct Validity “theoretical validity” • How well does your theory, measures, independent and dependent variables fit together?
Validity • Statistical Conclusion • Is there truth in measurement and inference? • External Validity • Do these results generalize to the real world?
? Population Parameter Population N Select Sample n Calculate and Make Statistical Inference Population (Mean, Confidence Interval, Significant Difference between Groups) Calculate Test Statistic Compare P with Alpha value Process for Analysis of Difference Design, select, control, assign appropriate to study purpose Check assumptions to select appropriate test statistic
Testing for Normal Distribution • Normal Distribution Assumption for Parametric Tests • The Shapiro Wilk test evaluates your sample for normal distribution • To use the mean as a central tendency measure for your sample, you want your sample distribution to not differ statistically from the normal distribution • For this assumption you want the null hypothesis of no statistical difference of your sample distribution from the true normal distribution • You want your p value to be greater than 0.05 for the Shapiro Wilk test to be in the “accept null region” ; This would mean your sample data can be considered normal • Results:: n = 10 Mean = 86.8 SD = 1.4757295747452441 W = 0.9367971792829276 Threshold (p=0.01) = 0.781000018119812 --> HO accepted Threshold (p=0.05) = 0.8420000076293945 --> HO accepted; p=0.842 which is greater than 0.05 threshold Threshold (p=0.10) = 0.8690000176429749 --> HO accepted --> Your data seems normal http://dittami.gmxhome.de/shapiro/ results from Shoulder Range data 84 85 89 86 87 87 87 88 88 87
t distribution basic introduction understandable http://www.youtube.com/watch?v=QoV_TL0IDGA Z and t probability table two tailed http://statpages.org/pdfs.html t distribution probability graphic http://www.stat.tamu.edu/~west/applets/tdemo.html t distribution probability graphic one and two tail http://onlinestatbook.com/calculators/t_calc.html
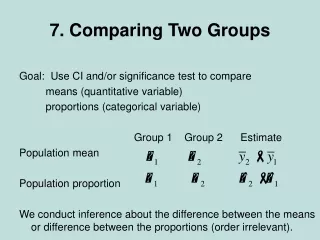
Check assumptions for 2 Independent Groups • Independent t test • 2 independent groups • Normal distribution each group • Equal variance between groups (note alternate form of test that does not require equal variance) • Interval or ratio scale • Mann-Whitney • 2 independent groups • Ordinal, interval, or ratio scale • Chi-squareFisher Exact • 2 independent groups • Nominal scale (discussed later in the semester in detail)
Null and Alternative Hypothesis Based on Statistical Inference The criteria for acceptance and rejection of the null hypotheses can be demonstrated using the normal probability distribution. The null hypothesis written as Ho: p ≥ 0.05 indicates no statistical difference between measures. With a probability greater than 0.05, you are within the non-rejection region of the null hypothesis. The null hypothesis of no statistical difference is retained (accepted). The alternative hypothesis written as Ha: p ≤ 0.05 indicates statistical difference between measures. With a probability less than 0.05, you are within the rejection region of the null hypothesis. The null hypothesis of no statistical difference is rejected and the alternative hypothesis of difference is retained. non-rejection region 95%
Confidence interval of Difference Graphic of Statistical Difference To answer the question statistically the 95% confidence interval of difference will need to be calculated. For this question the alpha was set at 0.05, 5% which means we would need to compute our confidence interval of difference at 95%. All three two group comparisons overlap the zero point as an indication of no difference. All three pairwise treatment conditions retained the null hypothesis of no difference. For example, the 95% confidence interval of difference between the control and experimental group 1 indicates that there is 95% confidence that the degree of difference between these two treatment populations was between a negative -5.8⁰ to a positive 9.2⁰. Since the confidence interval crosses zero, we fail to have statistical difference between these two treatment approaches
Distinguish Between Statistical Difference and Clinical Relevance • Statistical difference is math based on probability. It does not establish if there is a clinical difference in client outcome. • Clinical relevance should result in a discernible change for client outcome. http://www.rehabmeasures.org/rehabweb/allmeasures.aspx?PageView=Shared • Beyond statistical difference, a study should also address if there is a clinical difference in client outcome
References and Links • Experiment-Resources.com (2008). Research Methodology. Retrieved 17 Aug. 2012 from Experiment Resources: http://www.experiment-resources.com/research-methodology.html Research Steps, Design, Construct, Internal, External, Construct, Statistical Conclusion Validity http://www.experiment-resources.com/ • Z and t probability table two tailed http://statpages.org/pdfs.html • t distribution good basic content introductionhttp://www.youtube.com/watch?v=QoV_TL0IDGA • t distribution a little more detail in content discussion (optional) http://www.youtube.com/watch?v=XU_3fLy2SKs&feature=c-shelf-119 • How to calculate a t test Please watch (for understanding only, you do not have to do this hand calculation) • http://www.youtube.com/watch?v=OeH3Uzrjavg&feature=plcp • Vassar Stats Online Textbook: Chapter 11 Independent t test (optional http://vassarstats.net/textbook/