Understanding Two-Sample and ANOVA Tests for Comparing Means Across Groups
This guide covers key concepts in statistical methods for comparing means between two or more groups. We start with two-sample t-tests to analyze mean differences in scenarios such as income gaps between genders or SAT scores by race. Then, we delve into ANOVA (Analysis of Variance) to identify significant differences among three or more groups. The guide explains the calculations for means, standard errors, and the F-ratio, highlighting how to interpret testing results to reject or fail to reject the null hypothesis based on variances.

Understanding Two-Sample and ANOVA Tests for Comparing Means Across Groups
E N D
Presentation Transcript
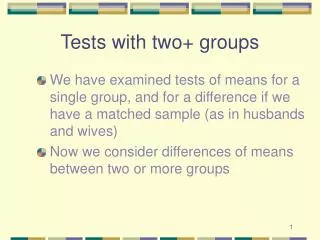
Tests with two+ groups • We have examined tests of means for a single group, and for a difference if we have a matched sample (as in husbands and wives) • Now we consider differences of means between two or more groups
Two sample t test • Compare means on a variable for two different groups. • Income differences between males and females • Average SAT score for blacks and whites • Mean time to failure for parts manufactured using two different processes
New Test - Same Logic • Find the probability that the observed difference could be due to chance factors in taking the random sample. • If probability is very low, then conclude that difference did not happen by chance (reject null hypothesis) • If probability not low, cannot reject null hypothesis (no diff. between groups)
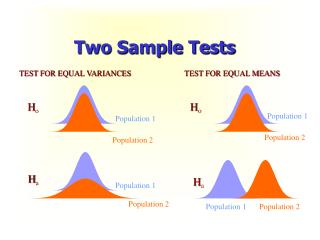
Sampling Distributions Note in this case each mean is not in the critical region of other sampling dist. Mean 1 Mean2
Sampling Distributions Note each mean is well into the critical region of other sampling distribution. Mean 1 Mean 2
Sampling Dist. of Difference Big Differences Hypothesize Zero Diff. Difference of Means
Procedure • Calculate means for each group • Calculate difference • Calculate standard error of difference • Test to see if difference is bigger than • “t” standard errors (small samples) • z standard errors (large samples) • t and z are taken from tables at 95 or 99 percent confidence level.
Standard error of difference Pooled estimate of standard deviation Divide by sample sizes
t test Difference of Means Standard error of difference of means If t is greater than table value of t for 95% confidence level, reject null hypothesis
Three or more groups • If there are three or more groups, we cannot take a single difference, so we need a new test for differences among several means. • This test is called ANOVA for ANalysis Of VAriance • It can also be used if there are only two groups
Analysis of Variance • Note the name of the test says that we are looking at variance or variability. • The logic is to compare variability between groups (differences among the means) and variability within the group (variability of scores around the mean) • These are call the between variance and the within variance, respectively
The logic • If the between variance is large relative to the within variance, we conclude that there are significant differences among the means. • If the between variance is not so large, we accept the null hypothesis
Examples Large Between Both examples have same Within Small Between
Variance • Calculate sum of squares and then divide by degrees of freedom • Three ways to do this
Total, Within, and Between • Total variance is the mean squared deviation of individual scores around the overall (total) mean • Within variance is the mean squared deviation of individual scores around each of the group means • Between variance is the mean squared deviation of group means around the overall (total) mean
Total, Within, and Between Total = SST/dfT Within = SSW/dfW Between = SSB/dfB
F test for ANOVA • The F statistic has a distribution somewhat like the chi-square. It made of the ratio of two variances. • For our purpose, we will compare the between and within estimates of variance • Create a ratio of the two -- called an F ratio. Between variance divided by the within variance
F-ratio • Table in the back of the book has critical values of the F statistic. Like the t distribution, we have to know degrees of freedom • Different than the t distribution, there are two different degrees of freedom we need • Between (numerator) and within (denominator)
Decision • If F-ratio for our sample is larger than the critical value, we reject the null hypothesis of no differences among the means • If F-ratio is not so large, we accept null hypothesis of no differences among the means
Example (three groups) Observations 1 2 3 4 5 6 7 8 9 Overall mean is 5 60
Example (within) Observations 1 2 3 4 5 6 7 8 9 2 5 8 Group Means 6
Example (between) Observations 1 2 3 4 5 6 7 8 9 2 5 8 Group Means Overall mean is 5 54
F-ratio • Between variance divided by within variance. • Between= 54 / 2 = 27 (remember k-1 degrees of freedom, so df = 3-1 • Within = 6 / 6 = 1 (remember n-k degrees of freedom, so df = 9-3 • F-ratio is 27/1 with 2 and 6 df • Critical value (95%) of F is 5.14