Importance of Differences in Market Segmentation & Statistical Significance for Marketing Strategies
420 likes | 533 Vues
Explore why differences between consumer groups are crucial for effective marketing strategies. Learn about statistical tests, P values, and testing methods for determining significance in market segmentation.

Importance of Differences in Market Segmentation & Statistical Significance for Marketing Strategies
E N D
Presentation Transcript
Testing for Differences Between Two Groups or Among More than Two Groups
Why Differences are Important • Market segmentation holds that within a market, there are different types of consumers who have different requirements, and these differences can be the bases of marketing strategies.
Why Differences are Important • Some differences are obvious – differences between teens’ and baby boomers’ music preferences. • Other differences are not so obvious and marketers who “discover” these subtle differences may take advantage of huge gains in the marketplace.
Why Differences are ImportantMarket Segmentation • Differences must be statistically significant • Statistical significance of differences: the differences in the sample(s) may be assumed to exist in the population(s) from which the random samples are drawn
Why Differences are ImportantMarket Segmentation • Differences must be meaningful • Meaningful difference: one that the marketing manager can potentially use as a basis for marketing decisions
Why Differences are ImportantMarket Segmentation • Differences should be stable • Stable difference: one that will be in place for the foreseeable future • Differences must be actionable • Actionable difference: the marketer can focus various marketing strategies and tactics, such as advertising, on the market segments to accentuate the differences between segments
Small Sample Sizes:The Use of a t Test or a z Test • Most of the equations in this chapter will lead to the computation of a z value. • There are certain circumstances in which the z test is not appropriate. • The t-test should be used when the sample size is 30 or less. • The t-test is defined as the statistical inference test to be used with small sample sizes (n is less than or equal to 30).
Determining Statistical Significance: The P value • Statistical tests generate some critical value usually identified by some letter; i.e., z, t or F. • Associated with the value will be a p value which stands for probability of supporting the null hypothesis (no difference or no association). • If the probability of supporting the null hypothesis is low, say 0.05 or less, we have significance!
Determining Statistical Significance: The P value • P values are often identified in SPSS with abbreviations such as “Sig.” or “Prob.” • P values range from 0 to 1.0. • See MRI 17.1 on page 491.
Some Example P Values and Their Meaning • First, we MUST determine the amount of sampling error we are willing to accept and still say the results are significant. Convention is 5% (0.05), and this is known as the “alpha error.”
Some Example P Values and Their Meaning • P=0.05… • P=0.01… • P=0.10… • P=0.051… • P=0.99… significant significant not significant not significant not significant
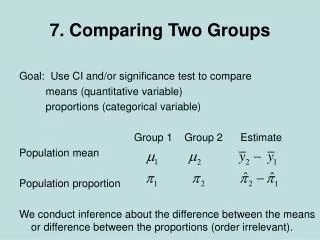
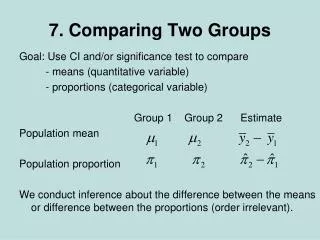
Testing Differences: Percentages or Means? • There are statistical tests for when a researcher wants to compare the means or percentages of two different groups or samples. • Percentages are calculated for questions with nominal or ordinal level of measurement. • Means are calculated for questions with interval or ratio (metric level of measurement.)
Testing the Difference Between Two Percentages • Null hypothesis: no difference between the means being compared • Alternative hypothesis: a true difference between the compared means
Testing the Difference Between Two Percentages • Finding if the difference between two percentages is significant? • Finding arithmetic differences between %s. • Translate the difference into number of standard errors from hypothesized value of 0. • Make an assessment of the probability of support for the null hypothesis. See formula…
Testing the Difference Between Two Percentages (p. 492) • Formula for significance of the difference between two percentages:
How do you know when the results are significant? • If the null hypothesis is true we would expect there to be 0 differences between the two percentages. • Yet we know that, in any given study, differences may be expected due to sampling error. • IF the null hypothesis were true, we would expect 95% of the z scores computed from 100 samples to fall between + and -1.96 standard errors.
How do you know when the results are significant? • IF the computed z value is greater than + or -1.96, it is not likely that the null hypothesis of no difference is true. Rather, it is likely that there is a real statistical difference between the two percentages.
2.5% 2.5% 95% +1.96 -1.96 Supported Not Supported Not Supported Tests of Differences between the Percents of 2 Groups p1 = p2 p1 > p2 p1 < p2
An Example: Testing the Difference Between Two Percentages (p. 495) • Last year a Harris Poll showed 40% of surveyed companies were coming to college campuses to hire seniors (n=400 companies surveyed). • This year, the Harris Poll reported the percentage is 65% (n=100 companies surveyed). • Is this a significant difference?
An Example: Testing the Difference Between Two Percentages (p. 495) • Applying the formula: P1=65 and P2=40 • Z=4.51 • Since the z value is greater than + or -1.96, the difference between the two percentages is significant!
Using SPSS to Test the Difference Between Two Percentages • SPSS does not perform tests of significance of the difference between the percentages of two groups, but you can use SPSS to generate the relevant information and perform a hand calculation. • ANALYZE, FREQUENCIES will produce the percentages you need.
Testing the Difference Between Two Means • The procedure for testing the significance of difference between two means from two different samples is identical to the procedure for testing two percentages. • Equations differ due to the use of a metric (interval or ratio) scale. • Note: Only use this test with large samples (30+).
An Example • Sports Soft Drinks: the difference between males (9) and females (7.5) is significant; z =6.43.
Using SPSS to Test Differences Between Two Group Means • The t-test is used to compare differences between two means (remember: “t for two”). • But the types of t-test depends upon whether the two groups upon which the means are calculated are independent (separate groups) or paired (the same group).
Using SPSS to Test Differences Between Two Group Means • If the two groups are different, i.e., males vs. females, you would use INDEPENDENT SAMPLES t-test. • If the two groups are from the same sample, you would use PAIRED SAMPLES t-test.
An Example • Is there a difference between subscribers vs. non-subscribers to City Magazine on “likely patronage”? • Since “likely patronage” is an interval scale, we can calculate a mean score. • There are two independent groups: subscribers vs. non-subscribers.
An Example • To determine if subscribers’ mean score on “likely” is different from non-subscribers’ mean on “likely,” we should use SPSS: • ANALYZE, COMAPRE MEANS, INDEPENDENT SAMPLES T-TEST (See p. 500.)
An Example • Is there a difference between the mean for “prefer simple décor” vs. the mean for “prefer elegant décor”? • Both “prefer simple décor” and “prefer elegant décor” are intervally scaled so it is proper to calculate a mean for each question.
An Example • Second, since the same members of the sample answered both questions, the two groups generating the means to these questions are not independent, they are paired. • Under these conditions, it is appropriate to use SPSS: • ANALYZE, COMPARE MEANS, PAIRED SAMPLES T-TEST (See p. 503.)
Online Surveys and Databases:A “Significance” Challenge to Marketing Researchers • Sample size has a great deal to do with statistical significance. • Sample size n appears in statistical formulas dealing with differences, confidence intervals, hypothesis tests, etc. • Online surveys allow data collection from large sample sizes, so most tests may be found to be significant • The difference should be meaningful as well.
Testing for Significant Differences Among More than Two Groups • ANOVA • Analysis of variance (ANOVA): used when comparing the means of three or more groups • ANOVA will “flag” when at least one pair of means has a statistically significant difference, but it does not tell which pair.
Testing for Significant Differences Among More than Two Groups • When the F values “Sig.” is less than or equal to 0.05, ANOVA is telling you that “at least one pair of means is significantly different.” • To determine which pair(s) are different, you must rerun the test and select a POST HOC test (Duncan).
Testing for Significant Differences Among More than Two Groups • Assume that we wish to know if the mean score on “likelihood of patronizing an upscale restaurant” differs across sections of newspaper read most. • ANALYZE, COMPARE MEANS, ONE-WAY ANOVA • “Likely” goes in Dependent list; “section of newspaper” goes in factor
Testing for Significant Differences Among More than Two Groups • Output shows Sig. Is 0.000 meaning at least one pair of means is different. • Now rerun the ANOVA but select Duncan under the POST HOC button.
In Summary: Test of Differences Among More than Two Groups • The basic logic • ANOVA (Analysis of Variance). • Test all pairs of averages simultaneously
In Summary: Test of Differences Among More than Two Groups • If no pair is different at the 95% level of confidence, stop the analysis and say all pairs are “Equal.” • If at least one pair is different at the 95% level of confidence, make a table to show what pairs are “Equal” or “Unequal” by running post hoc test.